Fair Value Gap Indicator
Every gap the definition admits from the size floor up, with states — nothing it refuses.
Most gap indicators draw whatever their author’s eye would have drawn. This one draws whatever the definition admits at or above the minimum-size floor — and its entire value is that the definition is frozen, stated, and the same for every user on every chart.
What it draws
Every three-candle imbalance passing the exact test — third candle’s low above first candle’s high for bullish, the mirror for bearish — with the band’s true boundaries, its midpoint line, and its live state: untouched, touched, midpoint reached, filled, or inverted under the stated invalidation rule.
Inverted gaps re-render in their flipped role, per the taxonomy’s own grammar, and remain distinguishable from fresh ones. Gaps below the minimum-size floor are not drawn at all, with the floor printed in the settings rather than buried in the code. Because the object is timeframe-relative — the same tape aggregated differently prints different gaps — the active timeframe travels with every label, and a gap’s whole history stays readable on the chart instead of living in the user’s memory. Nothing repaints: a state, once entered, is a fact about the past, and the display treats it as one.
Why frozen definitions matter more than features
Two people running the same fair-value-gap tool on the same chart routinely see different gaps, because most tools embed unstated thresholds.
Here every threshold is a named parameter with its shipped default visible, and the defaults come from one place: the detector campaign’s frozen definition set, the same geometry the measurement estate runs. Change a parameter and the indicator says so on the chart — a modified configuration is a different instrument, and pretending otherwise is how folklore gets laundered into findings. The same discipline governs the claims the tool declines to make: that price returns to gaps, that the midpoint is special, that fills arrive on schedule. The instrument draws a defined object and tracks its states; whether the object predicts anything is a measured question the line’s measurement layer reports on separately, whatever it finds. A drawing tool that implies its drawings are forecasts has sold something it does not have, and this one is built so it cannot.
The object it looks for
The frozen definition, drawn. This is the geometry the detector is built to find — not a capture of the instrument running, and not a result. A drawing that implied otherwise would be the one thing this line exists to refuse.
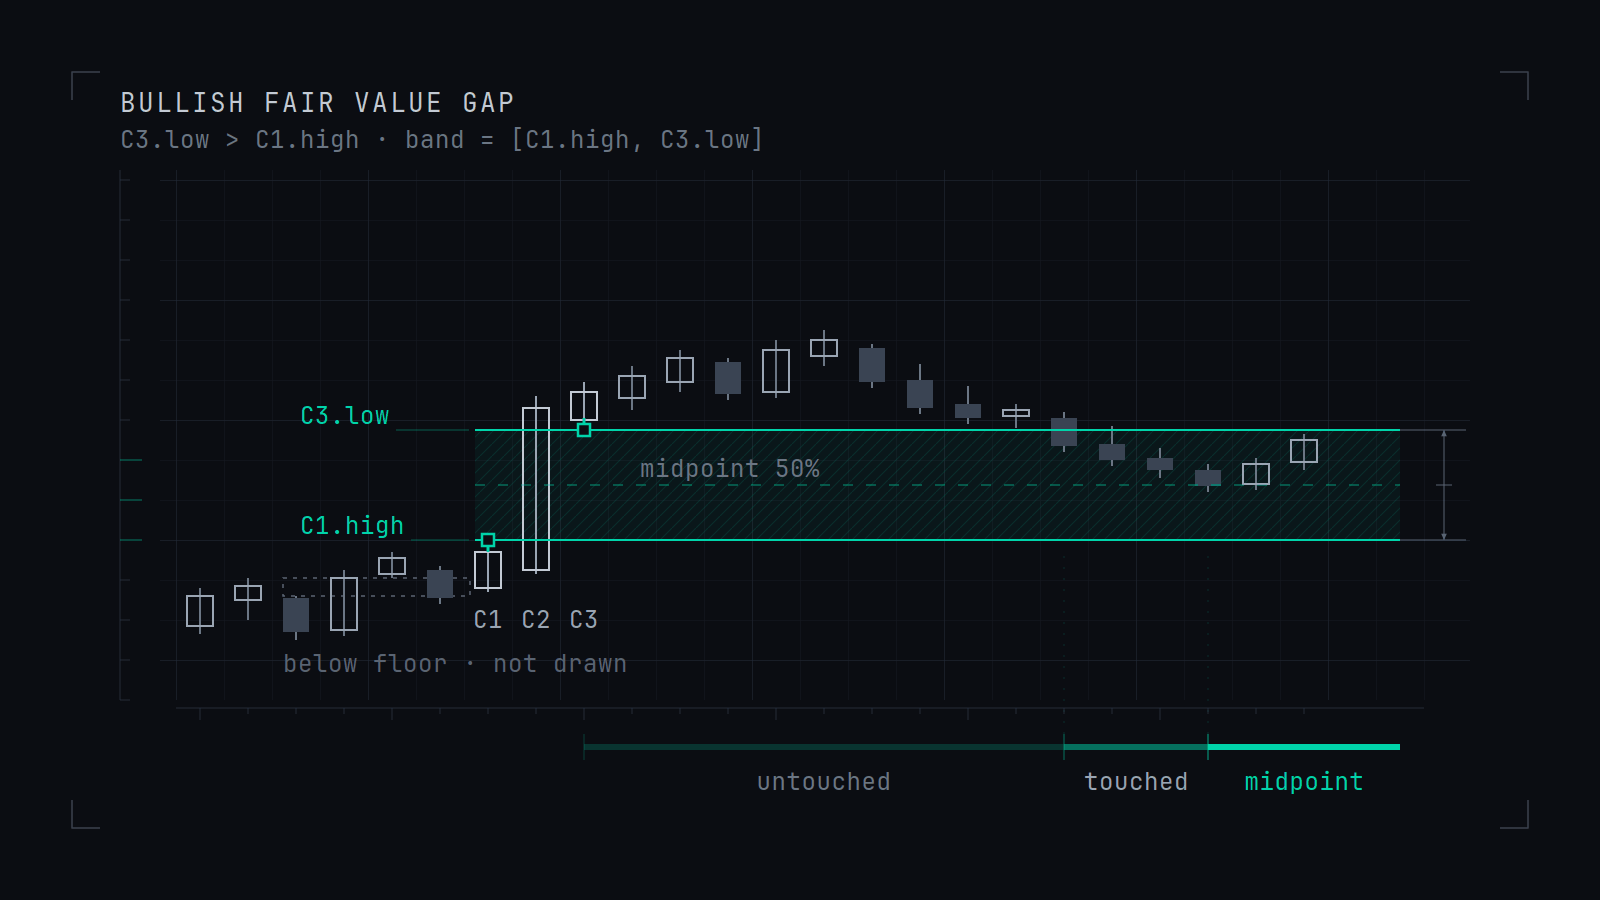
The three-candle arrangement the definition admits: the middle candle delivers far enough that the first candle’s high and the third candle’s low cannot overlap, and the span left between them is the gap.
A drawn gap establishes that the arrangement occurred. It does not establish that price returns to the span, or what follows if it does.
Fair Value Gap Indicator: what the frozen definition states, in full.
| Element | What the definition states |
|---|---|
| Test | Third candle’s low is above the first candle’s high (bullish). Mirrored for bearish. |
| CandlesThe same tape aggregated differently prints different gaps. | Exactly three, consecutive, on one stated timeframe. |
| The gap | The span between those two prices. |
| Fill | Later price trading back through the span. |
| Minimum sizeA floor below which a gap is not drawn is a parameter, not a fact about the market. | election pending |
| Not established | Whether price returns, how often, or what a return is worth. |
The definition in full, with the terms it uses, is at the glossary entry.
The parameters, in the open
Every threshold is a named parameter with its shipped state visible. Where a default reads election pending, the calibration run has not yet frozen it, and this page says so instead of inventing a number. Presets populate editable fields; they never lock them.
Fair Value Gap Indicator: every threshold it exposes, and the state each one is in.
| Parameter | Shipped state | What it decides |
|---|---|---|
| Gap test | C3.low > C1.high (bullish); mirror bearish | The three-candle comparison itself — fixed, because it is the definition rather than a preference. |
| Minimum size | election pending | ATR-scaled floor below which a gap is not drawn; the calibration run freezes the shipped default. |
| Invalidation rule | election pending | Wick-through versus close-through for the transition into the inverted state. |
| Midpoint line | on | The gap's 50% line — consequent encroachment — rendered as its own reference. |
| State display | untouched · touched · midpoint · filled · inverted | The full state machine, labelled on the chart, so a gap's history is visible rather than remembered. |
The calibration certificate
Every instrument in this line ships with its report: the reaction and state statistics for its objects, computed on this estate's own recorded data under the campaign's measurement design, with the vintage's hash and date printed — and a refusal state when the vintage ages past its declared cadence. The report ships whatever it says.
This instrument's certificateNOT YET COMPUTED
The campaign's entry bar is the reason: no driver takes a live reading before it recovers a planted effect through the measurement harness, and the harness comes before every certificate. The drafting instrument is in build for the platforms above. Nothing is purchasable yet, here or anywhere.
What this instrument does not do
It makes no claim that its objects predict anything, and it ships no signals. It draws defined geometry under stated parameters; whether that geometry carries information is the measurement layer's question, answered against stated nulls and published either way. No performance figures appear on this page because none have been computed — and when they are, they arrive as the certificate above, not as marketing.
The research on the claim it draws
The objects drawn by the Fair Value Gap Indicator are taught with a claim, and no research note on this site examines that claim.
Questions and answers
How does the Fair Value Gap Indicator identify a fair value gap?
With one fixed three-candle test. A bullish gap exists when the third candle's low sits above the first candle's high, and a bearish gap is the mirror; the band between those two prices is drawn at its true boundaries with its midpoint line. The test is not a setting, because it is the definition. What can be set is the minimum size, an ATR-scaled floor whose shipped default the calibration run freezes, and gaps below it are not drawn.
Which timeframe does it find fair value gaps on?
The one the chart is on, named on every label. A fair value gap is timeframe-relative: the same tape aggregated into different candles prints different gaps, so a gap on the hourly chart and a gap on the five-minute chart are different objects, and the label keeps them from being confused.
What do the states on each gap mean?
A gap moves through five labelled states: untouched, touched, midpoint reached, filled and inverted. The midpoint is the gap's 50% line, consequent encroachment. Inversion follows the invalidation rule in force, wick-through or close-through, and an inverted gap re-renders in its flipped role while staying distinguishable from a fresh one. Nothing repaints: a state, once entered, is a fact about the past.
Does this fair value gap indicator run on TradingView?
No. It is in build for MetaTrader 4, MetaTrader 5 and cTrader. What carries to any platform is the definition: the three-candle test, the state machine and every threshold's shipped state are set out on this page, so a gap drawn by another tool can be checked against the same test.
Does the indicator predict that price will return to a gap?
No. It declines the three claims gaps usually arrive with: that price returns to them, that the midpoint is special, and that fills arrive on schedule. It draws a defined object and tracks its states, and whether that object predicts anything is a measured question the line's measurement layer reports on separately, whatever it finds.
Where this sits
This instrument's concepts are defined in the glossary: fair value gap · consequent encroachment · inverse fair value gap · balanced price range · displacement · liquidity void. Its drivers sit in the claims ledger (W1.5, W2.8, W2.9) with their verdicts rendered honestly until computed.
Also in this line: Order Block Indicator · Liquidity Sweep Indicator · Market Structure Indicator · Displacement Indicator · Session & Killzone Clock · Liquidity Pools Indicator · Premium-Discount & OTE Indicator · Opening Gap Indicator · Judas & Silver Bullet Models · SMT Divergence Indicator · Candle Range Theory Indicator.
Standing policy
- No promise of profit, ever. Hadal makes no performance claims and carries no implied edge. Past measurements describe instrument behaviour — never future returns.
- You own risk management. Hadal cannot control it and does not insure it. Good tools do not fix bad discipline — and this site says so.
- Analytical tools, for discretionary use. Nothing here is investment advice or a recommendation to trade. Every decision, and every outcome, is yours.
The same statement stands in the footer of every page.Terms Privacy