55 / 97
Liquidity Void
Working definition
A moment in which resting orders are withdrawn faster than they are replaced, leaving stretches of the price axis with nothing to trade against, so that price traverses them in near-vertical jumps.
An order book in normal operation is self-healing: liquidity consumed at the touch is replenished from behind. A liquidity void is the failure of that replenishment — market makers withdraw simultaneously, ahead of an event or in reaction to a move already underway, and the book empties across a range of prices. Price does not then move through those levels in any meaningful sense; it jumps them, because there was nothing at them to trade against. On the tape this reads as consecutive prints separated by gaps that would be many spreads wide in normal conditions.
The consequences concentrate on resting orders. A stop-loss is a market order deferred: triggered inside a void, it executes wherever liquidity resumes, which can be far beyond the trigger price. The trader experiences catastrophic slippage, yet no mechanism misfired — the order did exactly what it promises, in a market that had temporarily stopped offering the thing the backtest assumed was always there. Historical bar data compounds the illusion: bars record traded prices, not the depth that was absent, so a simulation happily fills stop orders at prices that no live order could have achieved.
Voids are documented at every scale. The May 2010 US equity flash crash, the January 2015 removal of the Swiss franc floor, and the October 2016 sterling flash crash are the canonical large ones; miniature voids form routinely in the seconds around non-farm payrolls-class releases, when top-of-book depth thins before the print and the absorb/sweep balance tips hard toward sweeping. Spread widening is the visible leading edge; the void is what remains when widening gives way to withdrawal.
The measurable quantities are depth and gap structure: top-of-book size over time, the distribution of print-to-print jumps, and how both behave around scheduled events — all recoverable from recorded feeds, none visible in the candle chart that summarises them away.
Where it sits in the ICT sequence
The ICT vocabulary in the order the method is taught, with a step for each kind of object.
- Step
- 05 of 08 Imbalances: the bands price crossed one-sidedly and is expected to revisit
- Also at this step
- Fair value gap (FVG), Consequent encroachment (CE), Inverse fair value gap (IFVG), Balanced price range (BPR), Volume imbalance
- Before it
- Balanced price range (BPR)
- After it
- Volume imbalance
The shape, drawn
The smallest arrangement the definition admits. It is a drawing of a rule, not a reading of a market — nothing here is measured, and the table below it is the authoritative version.
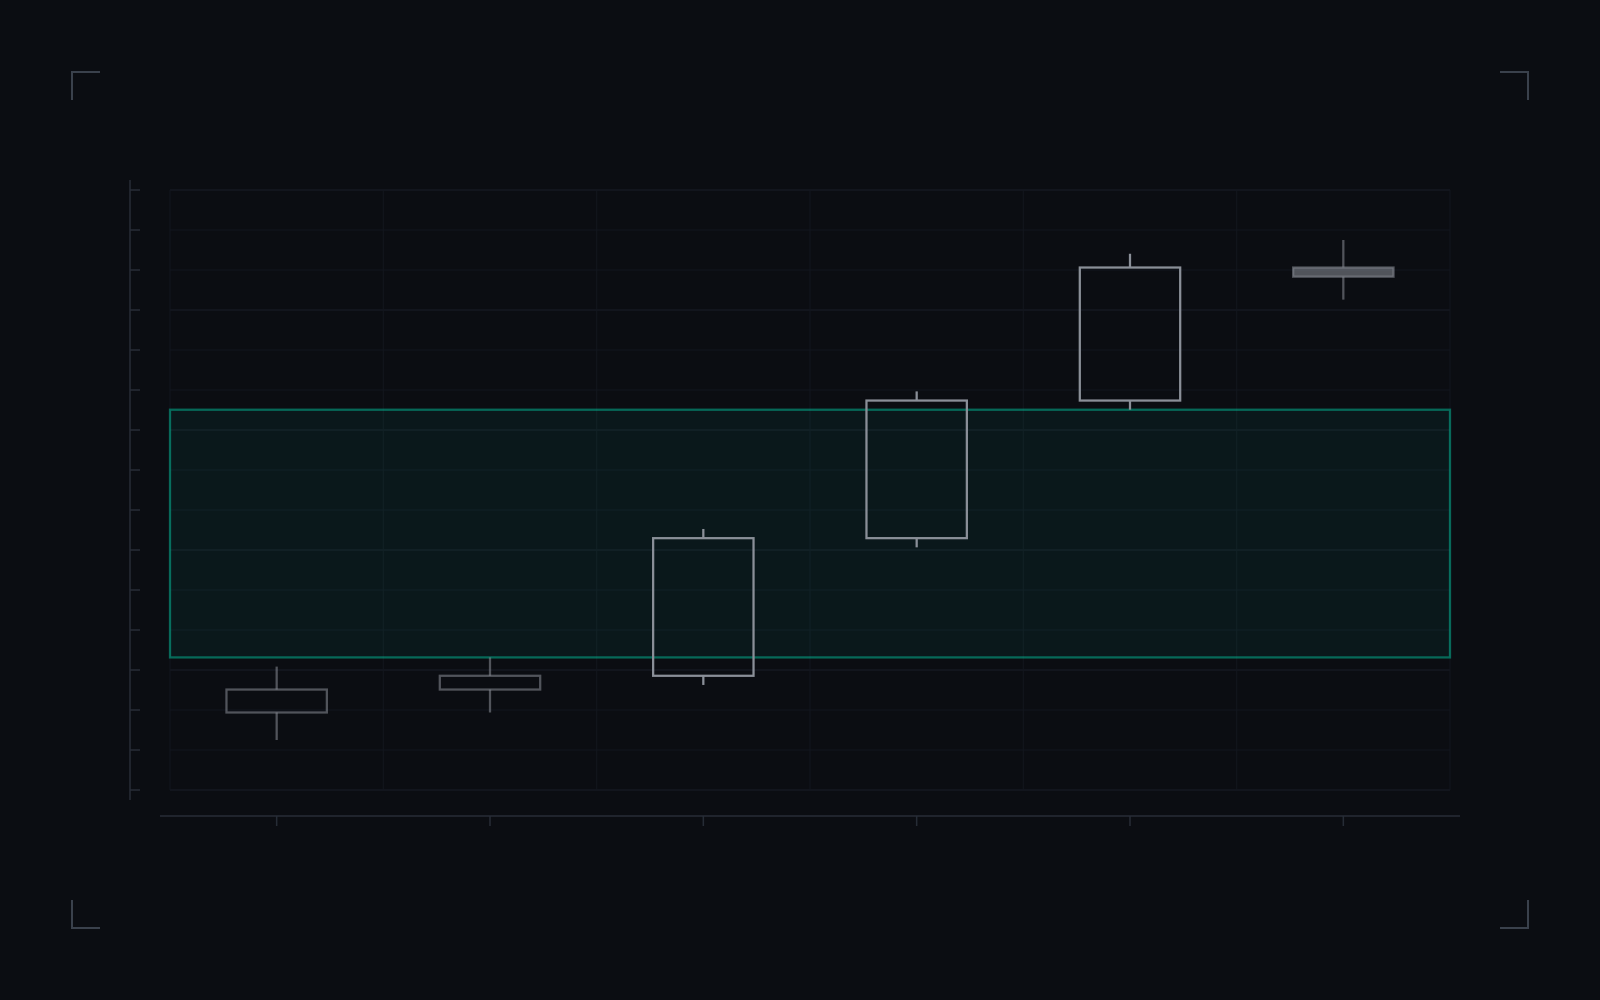
- Three consecutive one-directional candles, each opening near the prior close — price traversing, not trading.
- The void: the stretch of the price axis crossed with almost nothing resting against it.
Withdrawal faster than replacement, drawn: two quiet candles, then a run of near-vertical delivery through a span with nothing to trade against. The span itself is the void.
Marking a void establishes that the traversal happened in near-vertical jumps. It does not establish that price returns to fill it.
Liquidity Void: what the definition states, in full.
| Element | What the definition states |
|---|---|
| Mechanism | Resting orders withdrawn faster than they are replaced. |
| Signature | Near-vertical traversal: consecutive one-directional candles with minimal overlap. |
| Run lengthHow many consecutive candles constitute a run is a parameter, not a fact about the market. | election pending |
| Not established | Whether a void is refilled, how soon, or what a refill is worth. |
Commonly confused with
Neighbouring concepts that get used interchangeably, and the distinction that actually separates them.
- Spread widening
Widening is the visible leading edge; the void is what remains when widening gives way to withdrawal. A spread can widen with depth intact, and depth can evaporate while the quoted spread still looks ordinary — which is why they are two measurements rather than one.
- Quote fade
Fade is depth that was displayed and then withdrawn as you reached for it. A void is depth genuinely absent for everyone. One is a book reacting to your order; the other is a book that has stopped being a book.
- High volatility
Volatility describes how far price moves. A void describes whether there was anything to trade against while it moved. Price traversing empty levels is not the same event as price moving quickly through populated ones, and only the first strands a stop far from its trigger.
- A gap on the chart
The gap is the trace; the void is the cause. Bars record traded prices and not the depth that was absent, so a chart shows the jump while concealing the reason — which is exactly why simulations built on bar data fill orders at prices no live order could have achieved.
- Fair value gap
The fair value gap is a three-candle test with exact boundaries — the chart-level object a void often leaves behind. The void is the book-level cause, measured in depth; the gap is one of its candle-level traces, defined without any reference to the book at all.
- Displacement
Displacement is the candle geometry of the traversal — bodies dominating ranges as price crosses territory fast. The void is what the territory had become before the crossing. One describes the move, the other the emptiness it moved through.
How to measure it in your own data
A definition you cannot test is a definition you have to take on trust. This is the shortest honest route from the concept to a number you computed yourself.
- Records you need
Recorded order-book depth over time, print-to-print price sequences, and a schedule of events to align them against. Candle data cannot answer this: it summarises away the quantity being measured.
- What you compute
Top-of-book size over time, the distribution of print-to-print jumps expressed in spreads, and how both behave in the seconds around scheduled releases. All of it is recoverable from recorded feeds.
- What the answer tells you
A void shows as consecutive prints separated by gaps that would be many spreads wide in normal conditions, with top-of-book depth collapsing before rather than after. The trap for research is that nothing misfired: a stop is a market order deferred, and triggered inside a void it executes wherever liquidity resumes. The order did exactly what it promises, in a market that had temporarily stopped offering what the backtest assumed was always there.
If this has already cost you
If a stop filled far from its trigger, what depth existed at that moment is a question a recorded feed can answer.
- Stress Replay Assay“What happens to my sizing when the market breaks?”Will not establish: The next shock. By construction the events that break books are the ones the sample did not contain, and the report carries that sentence rather than burying it.
- Outage-Window Report“What did the platform outage actually cost me?”Will not establish: What you would have done. A counterfactual is bounded, not known — the report states the range the reference market offered, not the exit you would have taken, and whether the window’s cost is anyone’s liability is a question for the firm or your adviser, with the measurement in hand.
Intake is not open yet, so none of these can be commissioned today. They are listed here so you know the measurement exists and what it would and would not settle — the launch list hears first.
Questions and answers
Why did my stop fill so far from where I set it?
Because a stop is a market order deferred, and if it triggers inside a void it executes wherever liquidity resumes — which can be well beyond the trigger. Nothing malfunctioned. The order behaved exactly as specified in a market that briefly had nothing at the intervening prices to trade against.
Is a liquidity void the same as high volatility?
No, and conflating them hides the mechanism. Volatility is how far price moves; a void is whether anything was there while it moved. Price can move a long way through a populated book without stranding anyone, and it can jump a short distance through an empty one and take out every stop in between.
Why does my backtest not reproduce this?
Because historical bar data records traded prices and not the depth that was missing. The simulation sees a price printed and assumes it was available in size, so it fills stop orders at levels no live order could have reached. The illusion is in the data format rather than in the strategy.
When do voids occur?
At every scale. The canonical large ones are the May 2010 US equity flash crash, the January 2015 removal of the Swiss franc floor and the October 2016 sterling flash crash. Miniature voids form routinely in the seconds around major scheduled releases, when top-of-book depth thins before the print.
Related terms
Derived from the links this entry makes and the entries that link back to it.
Where the term is used
Instrument pages whose published copy uses this term. Each page states what it measures and what it does not establish.
Where the term is in build
Detector datasheets whose concepts include this term, or whose published copy uses it. Each one states the build state it has reached and the parameters it exposes, and carries no measured verdict.