95 / 97
Volume imbalance
Working definition
A gap between the bodies of two consecutive candles whose wicks still overlap: the second candle opens beyond the first candle's close, so the band between that close and that open traded only inside the candles' wicks. Bullish when the second candle opens above; bearish in mirror.
Two candles can touch at the wicks and still leave their bodies apart, and the volume imbalance is the name for the band between the bodies.
The construction
Two candles, one comparison of bodies and one of wicks. A bullish volume imbalance prints when the second candle opens above the first candle’s close, while the second candle’s low still reaches the first candle’s high or below it, so that the wicks overlap. The band runs from the first candle’s close up to the second candle’s open, and its midpoint is marked as on any imbalance. A bearish volume imbalance is the mirror: the second candle opens below the first candle’s close while its high still reaches the first candle’s low.
A worked case, with constructed numbers, on a five-minute EUR/USD chart. The first candle opens at 1.0850, trades up to 1.0862 and down to 1.0848, and closes at 1.0858. The second opens at 1.0861, trades up to 1.0870 and down to 1.0857, and closes at 1.0868. The bodies run from 1.0850 to 1.0858 and from 1.0861 to 1.0868, leaving a band from 1.0858 to 1.0861, three pips, with its midpoint at 1.08595. The wicks overlap between 1.0857 and 1.0862, so the band traded, and the two candles form a volume imbalance, not a true gap. If a third candle’s low then holds above 1.0862, the trio also prints a fair value gap above the first candle’s high: a different band, drawn by a different test.
The bearish mirror, again constructed: a candle opens at 1.2750 and closes at 1.2742 with a low of 1.2738; the next opens at 1.2739, reaches 1.2743 and closes at 1.2731. The bodies leave a band from 1.2739 to 1.2742, and the second candle’s high at 1.2743 overlaps the first candle’s low at 1.2738, so the band is a bearish volume imbalance.
The gap family, by what traded in the band
Three objects in the vocabulary are gaps, and they differ in how empty the band is:
- A true gap. Consecutive candles whose wicks fail to meet, so nothing traded in the band at all. The new day opening gap and the new week opening gap are the scheduled cases, left by trading halts.
- A volume imbalance. The bodies are apart and the wicks overlap, so the band traded, but only inside the two candles’ ranges, never as a close or an open.
- A fair value gap. Three candles whose outer wicks fail to meet, so the middle candle crossed the band while trading one-sidedly.
Stated this way the three are different tests at different granularity, and a count that mixes them is counting three populations as one.
Why bodies gap at all
A candle’s open is the first trade after the candle’s start time, and the previous candle’s close is the last trade before it. When price moves between those two trades, the bodies gap. On a liquid market at a short timeframe that happens constantly, by a tick or two; at the start of a session, after a release, or on a slower timeframe the band can be wide. That is why a minimum size, in ticks or against average true range, decides which volume imbalances exist in a count, and why two traders with different size rules can disagree about the same chart without either one misreading it.
Where the teaching uses it
Teaching treats the band as an imbalance price is expected to revisit, and a volume imbalance is resolved when price trades back through the gap between the bodies. It appears beside the larger imbalances rather than instead of them: a volume imbalance at the edge of a fair value gap or next to an order block is read as a narrower price inside a wider zone, and entries are sometimes placed at its edge or its midpoint rather than at the zone’s. That is a refinement with the usual trade-off: the narrower the entry band, the tighter the stop and the likelier price is to turn before reaching it.
Identifying one, step by step
- Declare the timeframe and the size rule, in ticks or against average true range.
- Compare each open with the previous close. A bullish candidate opens above it; a bearish candidate opens below it.
- Check the wicks. The second candle’s low must reach the first candle’s high or below it (bullish), or its high must reach the first candle’s low or above it (bearish). If the wicks do not meet, the band is a true gap.
- Draw the band and its midpoint, from the close to the open.
- Track the fill under a stated rule: a trade through the far edge, or a close beyond it.
Common mistakes
Marking every one-tick body gap as an imbalance, which fills a fast chart with objects no one would trade. Applying the body test to three candles and calling the result a fair value gap. Reading the name as evidence about volume. And judging volume imbalances by the ones price returned to, without counting the ones it never revisited.
What the band does not settle
The construction is exact and cheap to check: one comparison of bodies and one of wicks on every pair of candles. Whether price returns to these bands more often than to bands of the same size elsewhere, and whether their edges and midpoints hold, are distribution questions. The volume imbalance driver has a row in the claims ledger, where that verdict renders, and the two lenses keep the two-candle test apart from the claim about what price does at the band.
Where it sits in the ICT sequence
The ICT vocabulary in the order the method is taught, with a step for each kind of object.
- Step
- 05 of 08 Imbalances: the bands price crossed one-sidedly and is expected to revisit
- Also at this step
- Fair value gap (FVG), Consequent encroachment (CE), Inverse fair value gap (IFVG), Balanced price range (BPR), Liquidity Void
- Before it
- Liquidity Void
- After it
- Order block
The shape, drawn
The smallest arrangement the definition admits. It is a drawing of a rule, not a reading of a market — nothing here is measured, and the table below it is the authoritative version.
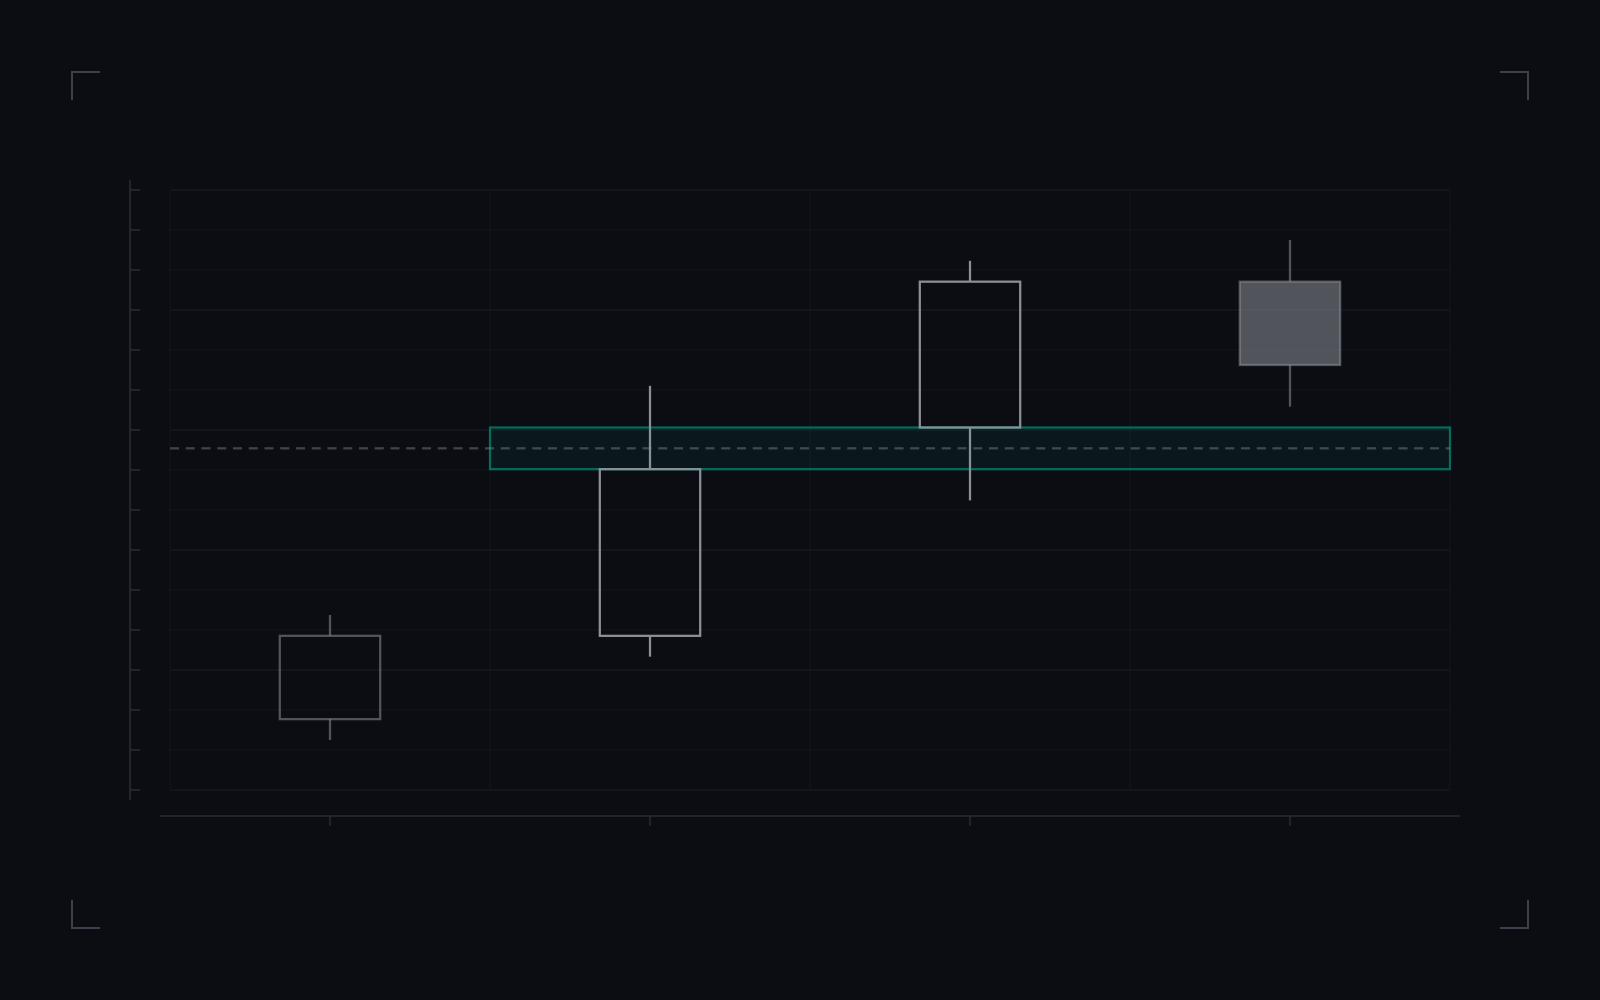
- Two consecutive candles. The second opens above the first one’s close, and the gap between their bodies is the imbalance.
- The volume imbalance: the band from the first candle’s close to the second candle’s open. Both wicks cross it, so it traded, but only inside the candles’ ranges.
- Its midpoint.
Two candles whose bodies do not meet while their wicks do: the band between the first close and the second open is the imbalance, crossed only inside the two candles’ wicks.
Drawing the two candles establishes the body gap and the wick overlap. It does not establish that price returns to the band.
Volume imbalance, bullish form: what the definition states, in full.
| Element | What the definition states |
|---|---|
| Test | The second candle opens above the first candle’s close, and its low reaches the first candle’s high or below. |
| Band | From the first candle’s close to the second candle’s open. |
| Wicks | Must overlap; where they do not meet, the band is a true gap. |
| Minimum sizeOne-tick body gaps are common on fast charts; a floor in ticks or against average true range decides which count. | election pending |
| Not established | Whether price returns through the band more often than through bands of the same size elsewhere. |
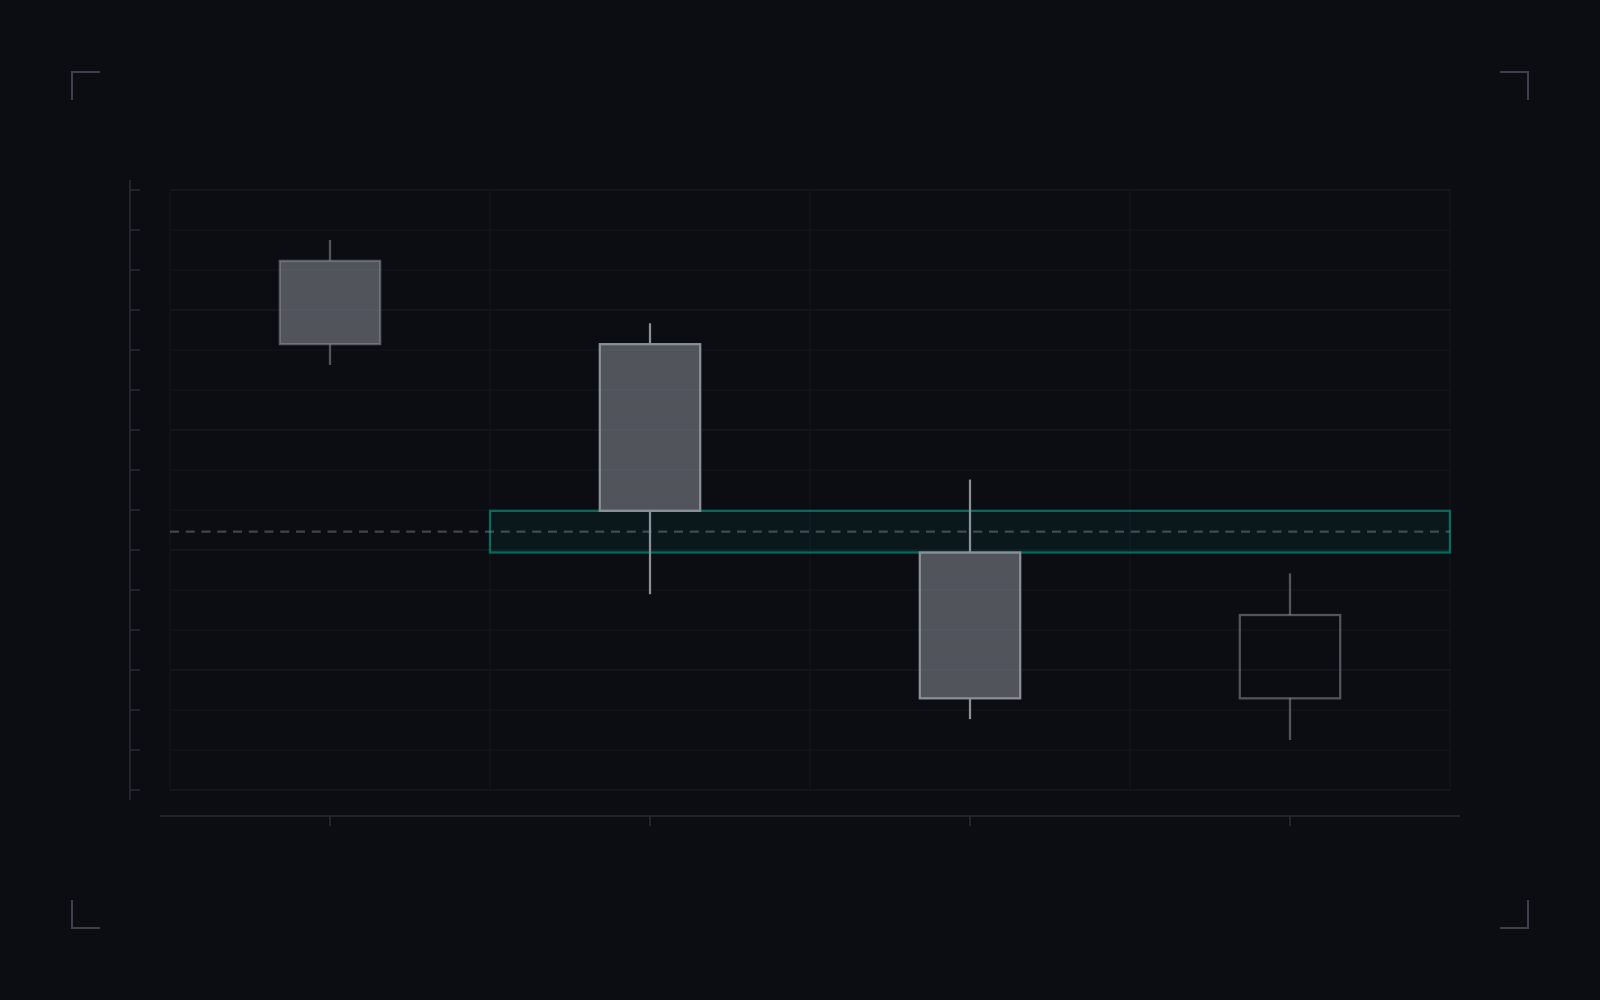
- Two consecutive candles. The second opens below the first one’s close.
- The bearish volume imbalance: the band from the second candle’s open up to the first candle’s close, crossed by both wicks.
- Its midpoint.
The mirror pair: the second candle opens below the first one’s close while its high still reaches back above the first one’s low, leaving a body gap the wicks cross.
Drawing the bearish pair establishes the same two tests in mirror. It does not establish what price does at the band.
Volume imbalance, bearish form: what the definition states, in full.
| Element | What the definition states |
|---|---|
| Test | The second candle opens below the first candle’s close, and its high reaches the first candle’s low or above. |
| Band | From the second candle’s open to the first candle’s close. |
| Not established | Whether rallies into the band stall there more often than at bands of the same size that are not imbalances. |
Commonly confused with
Neighbouring concepts that get used interchangeably, and the distinction that actually separates them.
- Fair value gap
Three candles, and the test is on wicks: the first and third candles' wicks fail to overlap. The volume imbalance is two candles, and the test is on bodies: the bodies gap while the wicks overlap. Wick overlap is the whole border between the two.
- A true gap
In a true gap even the wicks of consecutive candles fail to meet, so nothing traded in the band. In a volume imbalance the wicks cover the band, so it did trade, but only in passing, inside the candles' ranges.
- Order flow imbalance
Order flow imbalance is measured from the book and the tape: more aggressive buying than selling at a price, or the reverse. The volume imbalance is read from candle opens and closes alone, and despite its name it uses no volume data.
- New day opening gap
An opening gap forms across a trading halt, when nothing could trade. A volume imbalance forms between two candles in continuous trading, where the gap between the bodies is only the distance between one candle's last trade and the next candle's first.
How to measure it in your own data
A definition you cannot test is a definition you have to take on trust. This is the shortest honest route from the concept to a number you computed yourself.
- Records you need
Candle data at a declared timeframe, with opens and closes from a single feed. Nothing else: despite the name, no volume series enters the test.
- What you compute
For each pair of consecutive candles: bullish when the second candle opens above the first candle's close and the second candle's low is at or below the first candle's high; bearish in mirror. The band runs from the close to the open, with its midpoint. State a minimum size, since one-tick body gaps are common on fast charts, and track whether price trades back through the band.
- What the answer tells you
Two candles whose bodies leave a thin band between them, with the first candle's wick and the second candle's wick both crossing it. On fast charts the band is often a tick or two wide; after news, or on slower timeframes, it can be wide enough to see at a glance.
Questions and answers
What is a volume imbalance in trading?
A gap between the bodies of two consecutive candles whose wicks still overlap. The second candle opens beyond the first candle's close, and the band between that close and that open traded only inside the candles' wicks. ICT teaching lists it among the imbalances price is expected to revisit.
What is the difference between a volume imbalance and a fair value gap?
The number of candles and the part of the candle tested. A volume imbalance uses two consecutive candles and a gap between their bodies while the wicks overlap. A fair value gap uses three candles and a gap between the first and third candles' wicks. Where two consecutive candles' wicks fail to meet at all, the band is a true gap.
Does a volume imbalance use volume?
No. Despite the name, the test uses only candle opens, closes and wicks. A measurement of the volume actually traded at those prices would be a different object, closer to the order flow vocabulary.
Do volume imbalances get filled?
A volume imbalance is filled when price trades back through the band between the bodies. Narrow bands are crossed by ordinary movement, so a fill rate means something only when it is stated against the band's size and compared with bands of the same size that are not imbalances.
How do you find a volume imbalance on a chart?
Compare each candle's open with the previous candle's close. Where the open sits beyond the close and the two candles' wicks still overlap, mark the band between the close and the open and its midpoint, and keep only bands above a stated minimum size.
Related terms
Derived from the links this entry makes and the entries that link back to it.