62 / 97
New day opening gap (NDOG)
Written NDOG throughout.
Working definition
The price range between the close before a daily trading halt and the open after it — in ICT teaching, the 17:00 close and the 18:00 reopen in New York time that futures markets take on weekday evenings.
Futures stop trading for an hour on weekday evenings, and the new day opening gap is the price change across that hour.
The construction
The close is the last price before the halt at 17:00 New York time. The open is the first price after trading resumes at 18:00. The band between them is the gap: bullish when the market reopens above the close, bearish when it reopens below. Its midpoint is its consequent encroachment. The halt comes on the evenings of Monday to Thursday. Friday’s close leads into the weekend instead, and the gap from it to Sunday’s open is the new week opening gap.
A worked case, with constructed numbers, on an equity index future that trades in quarter-point ticks. The contract closes at 17:00 at 5,612.25 and reopens at 18:00 at 5,614.75. The gap runs from 5,612.25 to 5,614.75, two and a half points or ten ticks, with its consequent encroachment at 5,613.50. An overnight dip to 5,613.75 enters the gap and stops a tick short of its midpoint; a trade at 5,612.00 fills it.
Which markets have one
The gap exists where the halt exists, and the halt is a property of the market and the feed:
- Exchange futures. Equity index, interest rate, energy and metals futures on CME Globex pause for an hour every weekday evening, so each of those evenings prints a daily gap, often a small one.
- Spot currencies. There is no exchange and no mandatory pause. Positions roll at 17:00 New York time, and some brokers stop quoting briefly around it while many do not. On a feed without a pause there is no daily gap to draw.
- Crypto. Spot markets trade continuously and have no daily gap. The crypto futures listed in Chicago take the same evening pause as other futures and do print one.
The opening gap indicator datasheet makes the same point its first step: it measures whether an instrument’s feed actually halts before it draws a daily gap, rather than assuming one.
Small gaps and the few-ticks problem
Daily gaps are usually small, because an hour’s halt on a quiet evening moves little. That creates two problems the weekly gap rarely has. A gap a few ticks wide puts its edges and midpoint so close together that any reaction can be credited to one of the three lines, and on some evenings the reopen prints at the close and there is no gap at all. A minimum size, stated in ticks or against average true range, is the usual answer, and it is an election that decides which daily gaps exist in a count.
The last five, and the week
Teaching keeps several daily gaps on the chart, commonly the last five, each with its high, low and midpoint. With five weekly gaps kept as well, a chart can carry thirty lines of edges and midpoints, and the daily gaps of a given week often sit inside or beside its weekly gap. The density matters for any claim: the more lines a chart carries, the more likely a turn lands near one of them by chance.
Identifying one, step by step
- Confirm the halt on the feed. Look for the break in trading between 17:00 and 18:00 New York time. If the data has none, stop.
- Take the close of the last candle before 17:00.
- Take the open of the first candle at 18:00.
- Apply the size rule, and draw the band and its midpoint for the gaps that pass.
- State the fill rule, a wick or a close through the far edge, before tracking the gap’s states.
Trading it, as taught
Teaching reads a fresh daily gap as an early-session reference. When the next session opens away from it, a trade back into the gap, to its near edge or its midpoint, is a common opening scenario, planned for rather than assumed. One published rule ties the gap to the bias: with a bullish bias and price below the gap, wait for price to test the gap and close above it before buying, and mirror the rule for a bearish bias. As with every rule of this kind, the entry line, the confirmation and the stop are elections, and results depend on all three.
Common mistakes
Drawing daily gaps on a currency feed that never paused. Reading the halt from a broker’s server clock, which can shift it by hours. Treating a two-tick gap as a meaningful level. And judging the gaps by the reactions that happened, without counting the gaps price ignored.
What the gap does not settle
The construction is exact wherever the halt exists: two prices, a band and a midpoint. Whether daily gaps fill, how quickly, and whether their lines hold more often than comparable prices that are not gaps are distribution questions, and the daily gap driver has a row in the claims ledger, where that verdict renders. The two lenses keep the band apart from the claim about what price does there.
Where it sits in the ICT sequence
The ICT vocabulary in the order the method is taught, with a step for each kind of object.
- Step
- 02 of 08 Levels: the opens, gaps and ranges a session is measured from
- Also at this step
- New week opening gap (NWOG), Opening range gap (ORG), Central bank dealers range (CBDR), IPDA (interbank price delivery algorithm)
- Before it
- New week opening gap (NWOG)
- After it
- Opening range gap (ORG)
The shape, drawn
The smallest arrangement the definition admits. It is a drawing of a rule, not a reading of a market — nothing here is measured, and the table below it is the authoritative version.
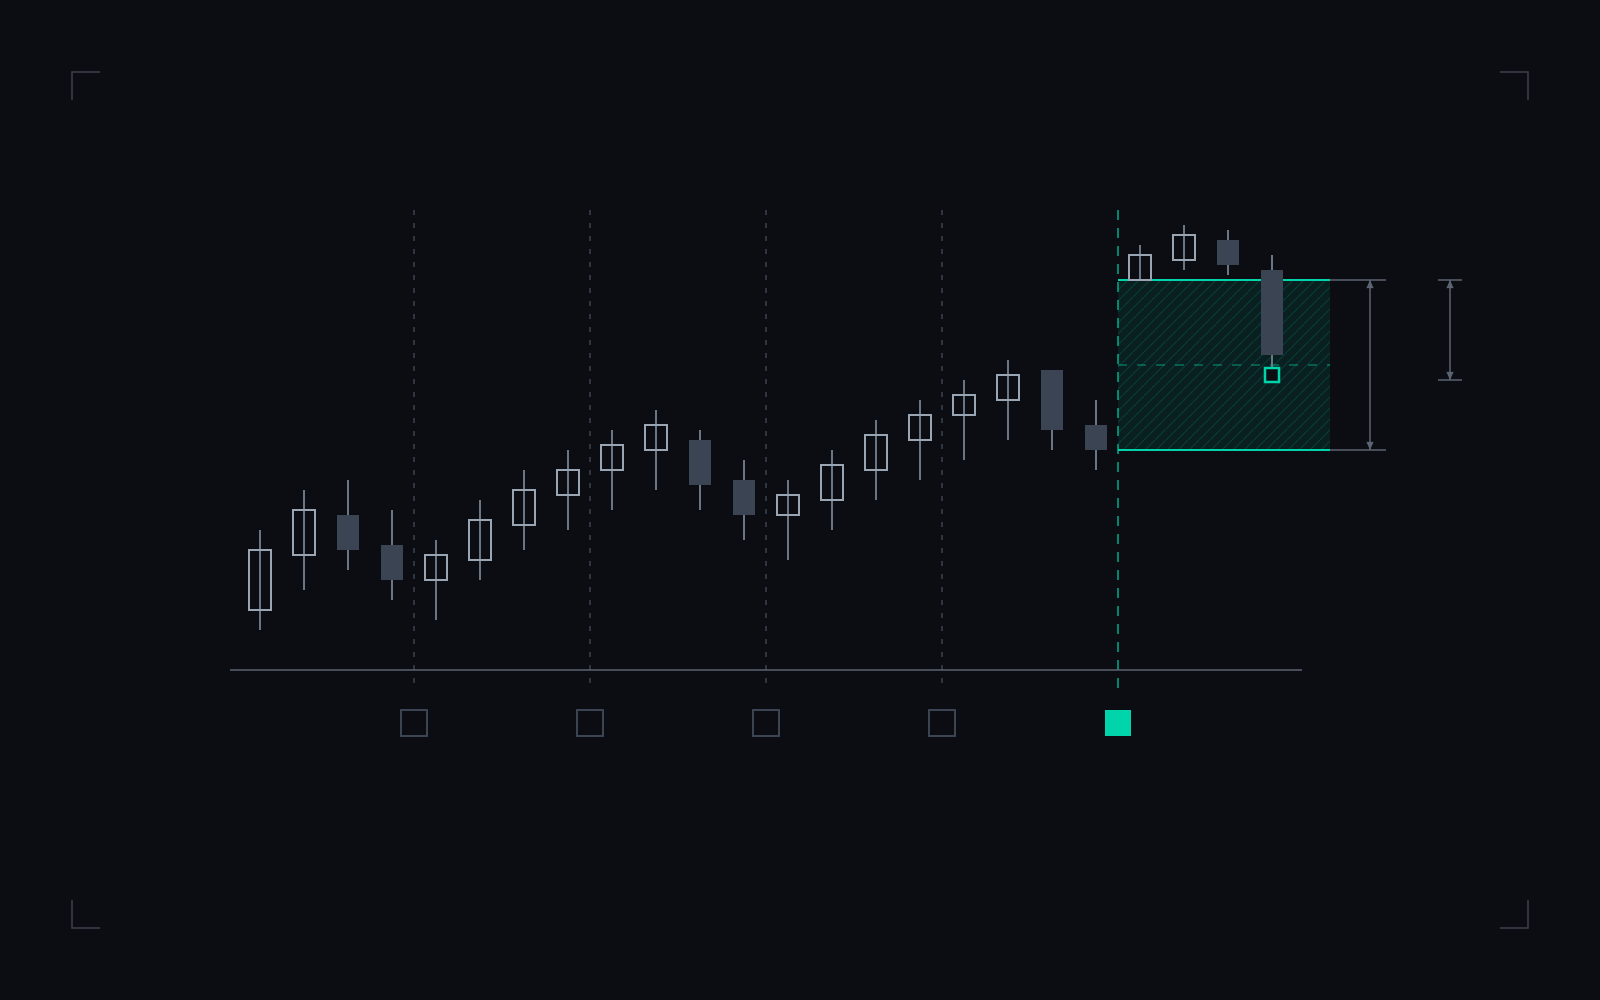
The census decides. Five session boundaries and one halt: the weekend gap is drawn because the census found a halt there, and the four daily boundaries are left empty because it did not — which is the answer, not a gap in the answer.
Drawing a gap establishes that a halt existed and how large the gap was against the instrument’s own volatility. It does not establish that the gap fills, or that a fill is worth anything.
New day opening gap (NDOG), the census, drawn: what the definition states, in full.
| Element | What the definition states |
|---|---|
| Gap censusMost spot FX has no daily halt to gap across. Where the census finds none, nothing is drawn, and nothing is the correct result rather than a missing one. | Measured per instrument, never assumed. |
| New-day gap | Daily halt close to open, where the census finds a halt. |
| New-week gap | Friday close to Sunday open. |
| Retention windowA stated window, so the map does not silently grow into a wall of every gap ever printed. | The last five weekly gaps. |
| Size scalingA gap measured in price says nothing until it is expressed against the instrument’s own volatility. | ATR-scaled. |
| Not established | Whether an opening gap fills, how often, or what a fill is worth. |
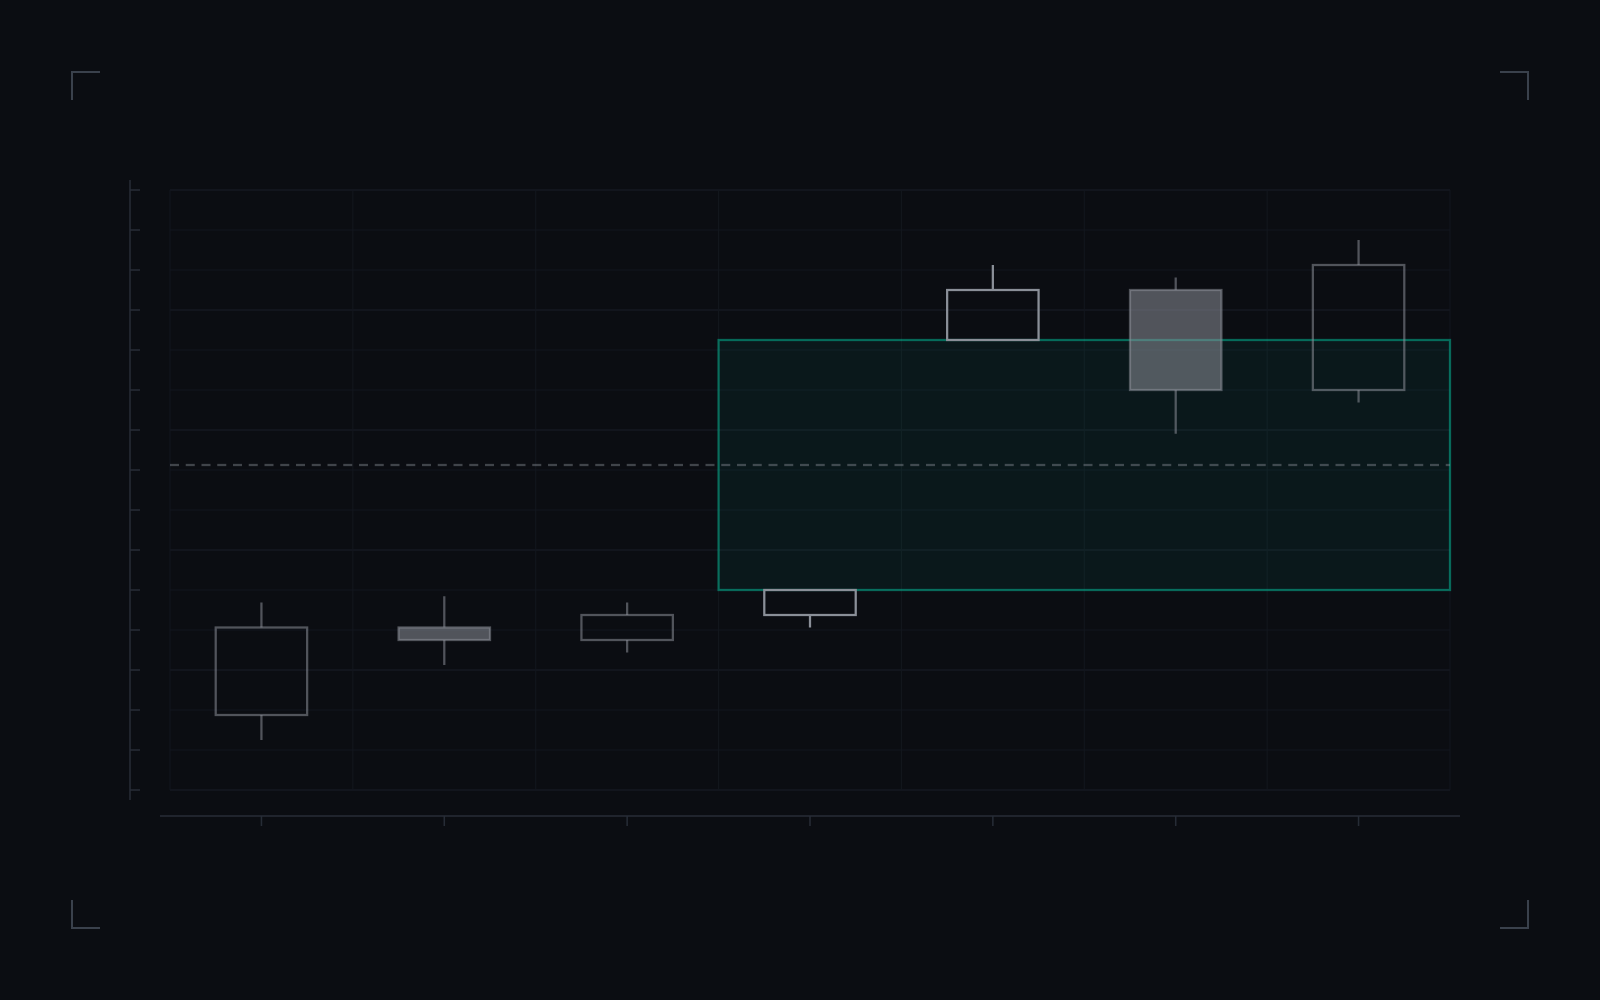
- The last candle before the 17:00 halt and the first at the 18:00 reopen.
- The new day opening gap: the band between the close before the halt and the open after it.
- Its midpoint, consequent encroachment.
- An overnight dip enters the band and stops above the midpoint.
The evening halt, drawn: the last close before 17:00, the first open at 18:00 above it, the band between them with its midpoint, and an overnight dip that enters the band and stops above the midpoint.
Drawing the daily gap establishes the band across one halt. It does not establish that the feed in use halts at all, or that price reacts at the band.
New day opening gap (NDOG), the gap, drawn: what the definition states, in full.
| Element | What the definition states |
|---|---|
| Close | The last price before the halt at 17:00 New York time. |
| Open | The first price after trading resumes at 18:00. |
| The haltFutures pause every weekday evening; many spot currency feeds never pause, and draw no daily gap. | measured per instrument and feed |
| Minimum sizeDaily gaps are often a few ticks wide; a floor decides which ones exist in a count. | election pending |
| Not established | Whether daily gaps fill, how quickly, or whether their lines hold. |
Commonly confused with
Neighbouring concepts that get used interchangeably, and the distinction that actually separates them.
- New week opening gap
The weekly gap spans the weekend halt and is kept on the chart for weeks. The daily gap spans the one-hour halt on weekday evenings and is usually kept for days. The construction, close to open with a midpoint, is the same.
- Fair value gap
A three-candle imbalance inside continuous trading, where the middle candle crossed the band one-sidedly. The daily opening gap forms across a halt with no trading at all, which is why the two stay separate objects even though teaching expects price to revisit both.
- Opening range gap
Measured in regular-session prices on United States index products, from one day's regular close to the next 09:30 open, across an overnight session in which the futures trade. The daily opening gap is measured across the evening halt itself, when nothing trades.
- The currency rollover
Spot currency positions roll at 17:00 New York time, and many brokers keep quoting straight through it. A rollover is a bookkeeping moment rather than a halt, so a currency chart may show no daily gap where a futures chart of the same pair shows one.
How to measure it in your own data
A definition you cannot test is a definition you have to take on trust. This is the shortest honest route from the concept to a number you computed yourself.
- Records you need
Intraday data with an unambiguous timezone converted to New York time, and the instrument's daily halts, measured from the data rather than assumed: exchange-listed futures pause on weekday evenings, while a spot currency feed may not pause at all.
- What you compute
For each daily halt the data actually contains, take the last close before it and the first open after it, then mark the band between the two prices and the line halfway across it. Track touches, midpoint and fill under a stated rule, keep a stated number of past gaps, and compare any count of reactions with matched levels that are not gaps.
- What the answer tells you
A small jump between the last candle before 17:00 and the first candle at 18:00 on a futures chart, often a few ticks wide, with its band and midpoint carried into the next session. On a feed with no halt there is nothing to see, and nothing should be drawn.
Questions and answers
What is a new day opening gap (NDOG)?
The price range between the last close before the daily trading halt and the first open after it. In ICT teaching the halt is the hour futures markets stop for on weekday evenings, from 17:00 to 18:00 New York time, and the gap's edges and midpoint are kept as reference levels for the sessions that follow.
What time is the NDOG?
Between the 17:00 close and the 18:00 reopen, New York time, on the evenings of Monday to Thursday. Friday's 17:00 close runs into the weekend, and the gap from it to Sunday's open is the new week opening gap.
Is there an NDOG in forex?
Only where the feed pauses. Spot currencies have no exchange halt on weekday evenings; some brokers stop quoting around the 17:00 rollover and many do not. A daily gap drawn on a feed that never paused is an object the data does not contain, so the halt is checked on the feed before any gap is drawn.
How many NDOGs should be on the chart?
Teaching commonly keeps the last five, each with its high, low and midpoint. The number is a convention, and a result quoted for one retention setting does not describe another.
What is the consequent encroachment of an NDOG?
Its midpoint, halfway between the close before the halt and the open after it. Daily gaps are often a few ticks wide, so the edges and the midpoint can sit so close together that a reaction at one is hard to tell from a reaction at another.
What is the difference between an NDOG and a fair value gap?
How the band came to be empty. A fair value gap is left inside continuous trading by a candle that moved one-sidedly; a daily opening gap is left by a halt, when no one could trade. Teaching treats both as prices to revisit, and each has its own construction and its own states.
Related terms
Derived from the links this entry makes and the entries that link back to it.
Where the term is in build
Detector datasheets whose concepts include this term, or whose published copy uses it. Each one states the build state it has reached and the parameters it exposes, and carries no measured verdict.