39 / 97
ICT daily bias
Working definition
The direction a trader expects the day to take, stated before the session from higher-timeframe structure, the nearest imbalance and the next draw on liquidity; in ICT teaching, a call on whether the day is more likely to reach the liquidity above the previous day's high or below its low.
Every ICT setup assumes a direction, and the daily bias is where that direction is decided, before the session starts.
What a bias is
A daily bias is a forecast with three parts: a direction, a target, and the session it covers. In ICT teaching the direction is framed through liquidity. Above the previous day’s high rest the buy-side orders and below its low the sell-side orders, as the buy-side and sell-side liquidity entry describes; a bullish bias expects the day to reach the orders above, and a bearish bias the orders below. It is a hypothesis about which side the day takes, not a trade. Entries still come from the rest of the vocabulary, inside the day.
The three inputs
Teaching reads three things before the session:
- Daily order flow. Whether recent daily candles have been taking out previous highs or previous lows. A run of days trading above each prior day’s high reads bullish; a run trading below each prior day’s low reads bearish.
- Imbalances to rebalance. The nearest fair value gap or other imbalance on the daily chart. An unfilled gap behind price is a place the day may return to before continuing, and it can point the day against the order flow.
- The next draw on liquidity. The draw on liquidity the higher timeframe points at: an old high or low, or an unfilled gap.
When the three agree, the bias is the direction they share. When they disagree the call is weaker, and a written record of which inputs disagreed is what later lets a reader see whether those days behave differently.
A worked case
Constructed numbers. On GBP/USD the previous day’s high was 1.2765 and its low 1.2702. Each of the last three daily candles traded above the high of the day before, so the daily order flow reads bullish. The nearest daily imbalance is a gap from 1.2680 to 1.2690, below the previous day’s low. The next obvious buy-side pool is last week’s high at 1.2798. Two inputs point up and one points down, toward the gap below price. A trader who weighs the order flow and the weekly high calls the day bullish, with the previous day’s high at 1.2765 as the first target and 1.2798 beyond it, and writes down before the open that a trade below 1.2702 before 1.2765 would score the call as wrong.
How the day is expected to unfold
Teaching pairs the bias with a picture of the session. On a bullish day the Asian session builds a range, London trades below the Asian low in the move the judas swing names, and New York delivers the move toward the target; a bearish day mirrors it. The picture is a template for the order of events, and the kill zones are the clock it runs on. A day can reach its target without following the template, and a bias is scored on where the day went, not on whether it followed the picture.
Daily inside weekly
A daily bias is usually made inside a weekly one. The weekly profiles are templates for when in the week the high and the low form, and a week read as bullish can still hold a bearish day, such as the early-week decline that sets a Tuesday low. The campaign’s frozen definitions compute the daily and weekly bias together and keep a resolution ledger for both, so that each call is scored on its own outcome.
Which previous day
“Previous day’s high” sounds unambiguous and is not. The day’s boundaries depend on the convention the chart uses. Currencies and futures conventionally close the day at 17:00 New York time; many currency platforms draw daily candles from midnight on the server’s clock; and United States equity index futures also have a regular session, from 09:30 to 16:15, whose high and low differ from the full day’s. The same instrument can show three different previous-day highs, and a bias scored against one of them is not the same forecast as a bias scored against another. The convention is part of the bias, and it is stated with it.
The bias and the other levels
Several other tools wait for the bias. The central bank dealers range projects the day’s high and low only once a buy day or a sell day has been called. The weekly and daily opening gaps, the new week opening gap and the new day opening gap, are read as destinations in the direction the bias points. And the IPDA data ranges set the larger frame: a bullish call made from the discount half of the 20-day range, pointing toward its high, is the kind of agreement the teaching looks for. None of these tools supplies the bias; each assumes one.
Scoring a bias
A bias is a forecast only if it can be wrong, and it can be wrong only if the rule for wrong is written first. A usable rule has three outcomes: correct if the day reaches the named side’s level before the other side’s, wrong if it reaches the other side first, and unscored if it reaches neither. The rule is written before the open, with a time stamp. Over many days the hit rate means something only against a baseline, such as the simple rule of calling the direction of the previous day’s candle. A way of forming the bias that cannot beat that rule is not adding information, however well the charts that illustrate it look.
Stating one, step by step
- Before the session, mark the previous day’s high and low and the week’s high and low.
- Read the daily order flow: which extremes recent days have taken.
- Mark the nearest daily imbalance, and whether price is likely to revisit it first.
- Name the draw on liquidity on the higher timeframe.
- Write the bias: the direction, the first target, the level that would score it wrong, and the time.
- Score it at the close, and keep the record, including the days it was wrong.
Common mistakes
Setting the bias after the open, when the day has already shown its hand. Changing it at midday and keeping the second call as the record. Never scoring it, so that every day becomes a lesson rather than a result. Treating the bias as an entry signal. And forming it on a lower timeframe than the day it forecasts.
What a bias does not settle
A stated bias is checkable in the simplest way a forecast can be: it named a side, and the day either reached that side first or did not. Whether a given way of forming the bias beats a simple baseline over many days is a measurement, and the daily bias driver has a row in the claims ledger, where that verdict renders. The two lenses keep the three inputs, which anyone can read from a chart, apart from the claim that they forecast the day.
Where it sits in the ICT sequence
The ICT vocabulary in the order the method is taught, with a step for each kind of object.
- Step
- 03 of 08 Liquidity: the resting orders, and whether price has taken them
- Also at this step
- Buy-side and sell-side liquidity, Draw on liquidity (DOL), Liquidity sweep, Inducement, Judas swing, Turtle soup, Candle range theory (CRT), SMT divergence
- Before it
- Draw on liquidity (DOL)
- After it
- Liquidity sweep
The shape, drawn
The smallest arrangement the definition admits. It is a drawing of a rule, not a reading of a market — nothing here is measured, and the table below it is the authoritative version.
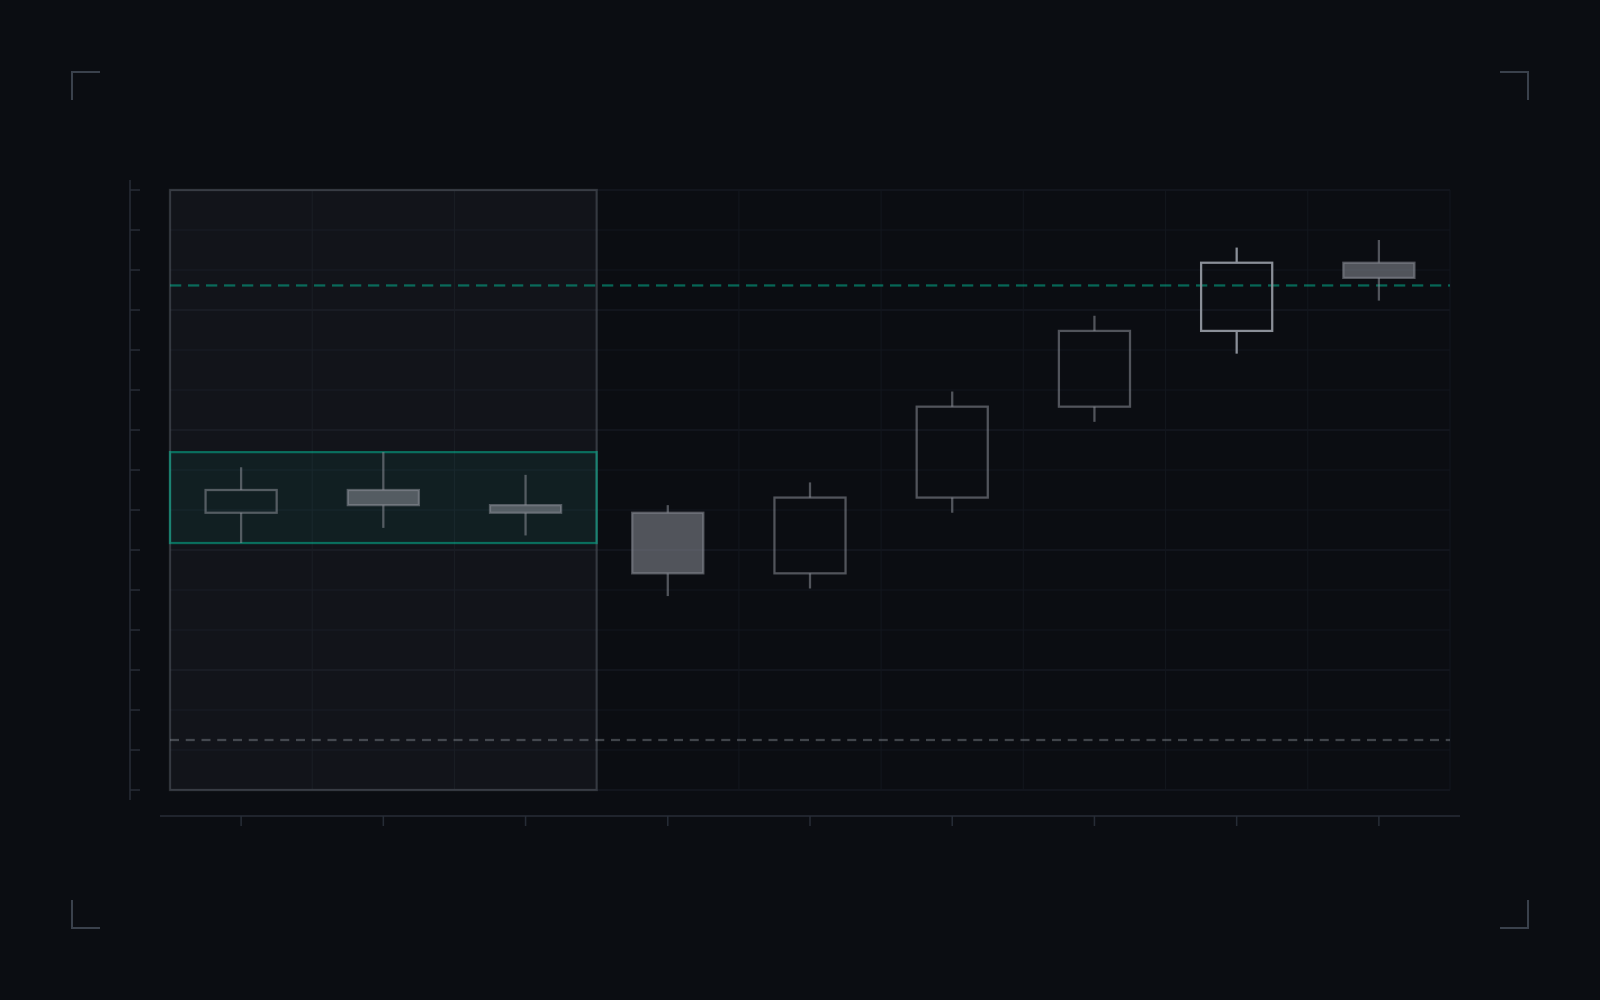
- The previous day’s high, the side the bullish call named. The call scores as correct when the day trades above it before trading below the previous day’s low.
- The previous day’s low: the level that would have scored the call wrong had the day reached it first.
- The Asian session, which builds the day’s first range.
- The Asian range. London trades below its low before the move up, the order of events the taught template expects.
- The first trade above the previous day’s high: the call resolves here.
A bullish day, scored: the Asian session builds a range, London trades below it, and New York takes the previous day’s high before the previous day’s low was reached, so the call written before the open resolves as correct.
Drawing a day that resolved as called establishes what the scoring rule looks like. It does not establish that the inputs call days well.
ICT daily bias: what the definition states, in full.
| Element | What the definition states |
|---|---|
| Stated | Before the session: the direction, the first target and the level that would score the call wrong. |
| Inputs | Daily order flow, the nearest imbalance, the next draw on liquidity. |
| Correct | The named side’s level is reached first. |
| WrongDays that reach neither level are unscored. | The other side’s level is reached first. |
| Not established | That the inputs call days better than a baseline such as the previous day’s direction. |
Commonly confused with
Neighbouring concepts that get used interchangeably, and the distinction that actually separates them.
- Draw on liquidity
The draw on liquidity is the target: the pool price is expected to reach next. The daily bias is the direction for the day, which usually points at that target. A bias can be right about direction and wrong about how far the day goes.
- Weekly profiles
Weekly profiles are templates for when in the week the high and the low form. The daily bias is a call about one day's direction, often made inside the frame a weekly profile sets.
- A trend
A trend describes what price has done over many bars. A bias is a forecast for one session, made before it opens, and it can point against the trend on a day the method expects price to return to an imbalance first.
- Market sentiment
Sentiment surveys what participants think or how they are positioned. The daily bias is one reader's structured forecast from the chart, written down before the session.
How to measure it in your own data
A definition you cannot test is a definition you have to take on trust. This is the shortest honest route from the concept to a number you computed yourself.
- Records you need
Daily and intraday candles on a stated session convention, the previous day's high and low, and a record of each bias written and time-stamped before the session opens, with the direction and the target it named.
- What you compute
Score each bias under a rule stated in advance: correct if the day reaches the named side's level before the other side's, wrong if it reaches the other side first, and unscored on days that reach neither. Compare the hit rate with a simple baseline, such as always calling the direction of the previous day's candle.
- What the answer tells you
A note written before the open that names a direction, a target and three reasons. Without that note, any day can be explained afterwards, which is why the time stamp matters more than the chart.
Questions and answers
What is daily bias in ICT trading?
The direction a trader expects the session to take, decided before it opens. In ICT teaching it is a call on which side of liquidity the day is more likely to reach first: the orders resting above the previous day's high, or those below its low.
How do you determine daily bias?
Teaching checks three things before the session: the daily order flow, meaning whether recent daily candles have been taking previous highs or previous lows; the nearest imbalance price may return to; and the next draw on liquidity. When the three agree, the bias points toward the liquidity they share.
When should daily bias be set?
Before the session opens, and in some teaching before the London open, then held for the day. A bias changed during the session stops being a forecast and becomes a description of what has already happened.
What is the difference between daily bias and weekly bias?
Scale. A weekly bias is a call on the week's direction, often read from where the week's high and low are expected to form; the daily bias is the same kind of call for one session, usually made inside the weekly one. The two can disagree on a day the week is expected to retrace.
How do you know if your daily bias is right?
By scoring it against a rule written before the session, such as which of the previous day's extremes the day reaches first. A bias that is never scored cannot be wrong, and a hit rate means little until it is compared with a simple baseline like the previous day's direction.
Which daily candle does ICT daily bias use?
The convention has to be stated, because it changes the previous day's high and low. Currencies and futures conventionally close the day at 17:00 New York time, many currency platforms start the day at server midnight, and index futures also have a regular session from 09:30 to 16:15. A bias scored against one of those days is a different forecast from a bias scored against another.
Related terms
Derived from the links this entry makes and the entries that link back to it.