13 / 97
Central bank dealers range (CBDR)
Written CBDR throughout.
Working definition
The price range traded between 14:00 and 20:00 New York time, usually measured on candle bodies, which ICT teaching uses to project the next day's high and low in multiples of the range's own height; also written central bank dealing range.
Six hours of the New York afternoon and evening make a box, and the central bank dealers range is the method’s way of turning that box into a forecast of the next day’s range.
The window and the name
The range runs from 14:00 to 20:00 New York time, from the New York afternoon to the moment the Asian window opens. The sources that spell out the initials write central bank dealers range; many pages, and most searches, write central bank dealing range. Both mean the same six hours. The name belongs to the teaching’s story about who trades in that window, and the construction does not depend on it: it is a range measured on a clock.
Measuring it
Two elections come first. Bodies or wicks: teaching prefers the highest and lowest candle bodies in the window, and one guide allows wicks when the bodies are too small to give a usable range. The size rule: the range is expected to be under 40 pips, and sources disagree on the ideal, one naming 20 to 30 pips and another 10 to 20. A range over the limit is treated as unusable for the next day’s projections. One guide adds that a major release, such as the payrolls report, can carry the day’s move out to the second or third deviation, which is a reason to keep release days apart in any count.
A pip threshold also travels badly. Forty pips is a quiet afternoon in one pair and a busy one in another, so a threshold stated against average true range would compare pairs more fairly. It is an election like the others, and a result quoted without it cannot be repeated.
The deviations
Once the range is measured, its height is copied upward and downward. One deviation above is the range’s high plus its height; two deviations add the height again; three, again. The same lines sit below the low. Teaching calls these standard deviations. They are not the statistical measure of that name, which describes how widely values spread around a mean; they are evenly spaced multiples of one day’s range.
A worked case, with constructed numbers. On EUR/USD the highest body in the window is at 1.0874 and the lowest at 1.0852, a range of 22 pips, under the 40-pip limit. The deviation lines above sit at 1.0896, 1.0918 and 1.0940; below, at 1.0830, 1.0808 and 1.0786.
Buy days and sell days
The projections are read through a bias, and teaching says the projection requires one. On a day read as a sell day, the day’s high is expected within two deviations above the range, often within one, and the day’s low is projected further down, as far as the third deviation below. On a buy day the rules mirror: the low within one or two deviations below, the high projected up to the third above. In the worked case, a sell day would look for its high near 1.0896 or 1.0918 and for its low toward 1.0786. The projection does not supply the bias; the daily bias entry covers how the method states one.
When the range is too wide
On days the dealers range breaks the size rule, one guide’s advice is to stand aside from the projections and let price do what it wants, apart from short-term trades. The daily profiles taught alongside the range combine it with the Asian range, from 20:00 to midnight New York time, and with the move after midnight that the judas swing names. The campaign’s frozen definitions also name a fallback window for wide days, the flout range, whose construction the published pages do not spell out.
The window in other time zones
The window is on the New York clock, so its local time moves when New York changes its clocks. Converted through the tz database, with the times running into the next day where they cross midnight:
- UTC: 19:00 to 01:00 on New York standard time; 18:00 to 00:00 on New York daylight time.
- United Kingdom: 19:00 to 01:00 in both seasons, except in the few weeks a year when the two countries’ clocks disagree.
- Nigeria: 20:00 to 02:00, or 19:00 to 01:00 on New York daylight time.
- United Arab Emirates: 23:00 to 05:00, or 22:00 to 04:00.
- Pakistan: 00:00 to 06:00, or 23:00 to 05:00.
- India: 00:30 to 06:30, or 23:30 to 05:30.
- Singapore, Malaysia and the Philippines: 03:00 to 09:00, or 02:00 to 08:00.
Projecting, step by step
- Set the chart to New York time, on a timeframe fine enough to see the window, such as fifteen minutes.
- Mark 14:00 to 20:00 and take the highest and lowest candle bodies inside it.
- Apply the size rule. Over the limit, skip the projection for the day.
- Draw the deviation lines, one, two and three heights above the high and below the low.
- Read them through the bias, and write down in advance which lines the day is expected to reach, so the forecast can be scored.
Common mistakes
Measuring the window on a broker’s server clock. Switching between bodies and wicks from one day to the next. Carrying a 40-pip rule from one pair to another as if pips meant the same thing in both. Reading the deviations as statistics. And counting the days whose extremes landed near a line without asking how often a line of the same spacing drawn from another window would have done as well.
What the lines do not settle
The construction is arithmetic anyone can repeat: a window, a range, and evenly spaced copies of its height. The claim is that the next day’s extremes favour those lines. Inside the ladder every price sits within half a range of some line, so landings near a line are guaranteed to happen often, and the test has to be a comparison: landings at these lines against landings at lines projected from six-hour windows at other times, on the same days. The dealers range driver has a row in the claims ledger, where that verdict renders, and the two lenses keep the arithmetic apart from the forecast.
Where it sits in the ICT sequence
The ICT vocabulary in the order the method is taught, with a step for each kind of object.
- Step
- 02 of 08 Levels: the opens, gaps and ranges a session is measured from
- Also at this step
- New week opening gap (NWOG), New day opening gap (NDOG), Opening range gap (ORG), IPDA (interbank price delivery algorithm)
- Before it
- Opening range gap (ORG)
The shape, drawn
The smallest arrangement the definition admits. It is a drawing of a rule, not a reading of a market — nothing here is measured, and the table below it is the authoritative version.
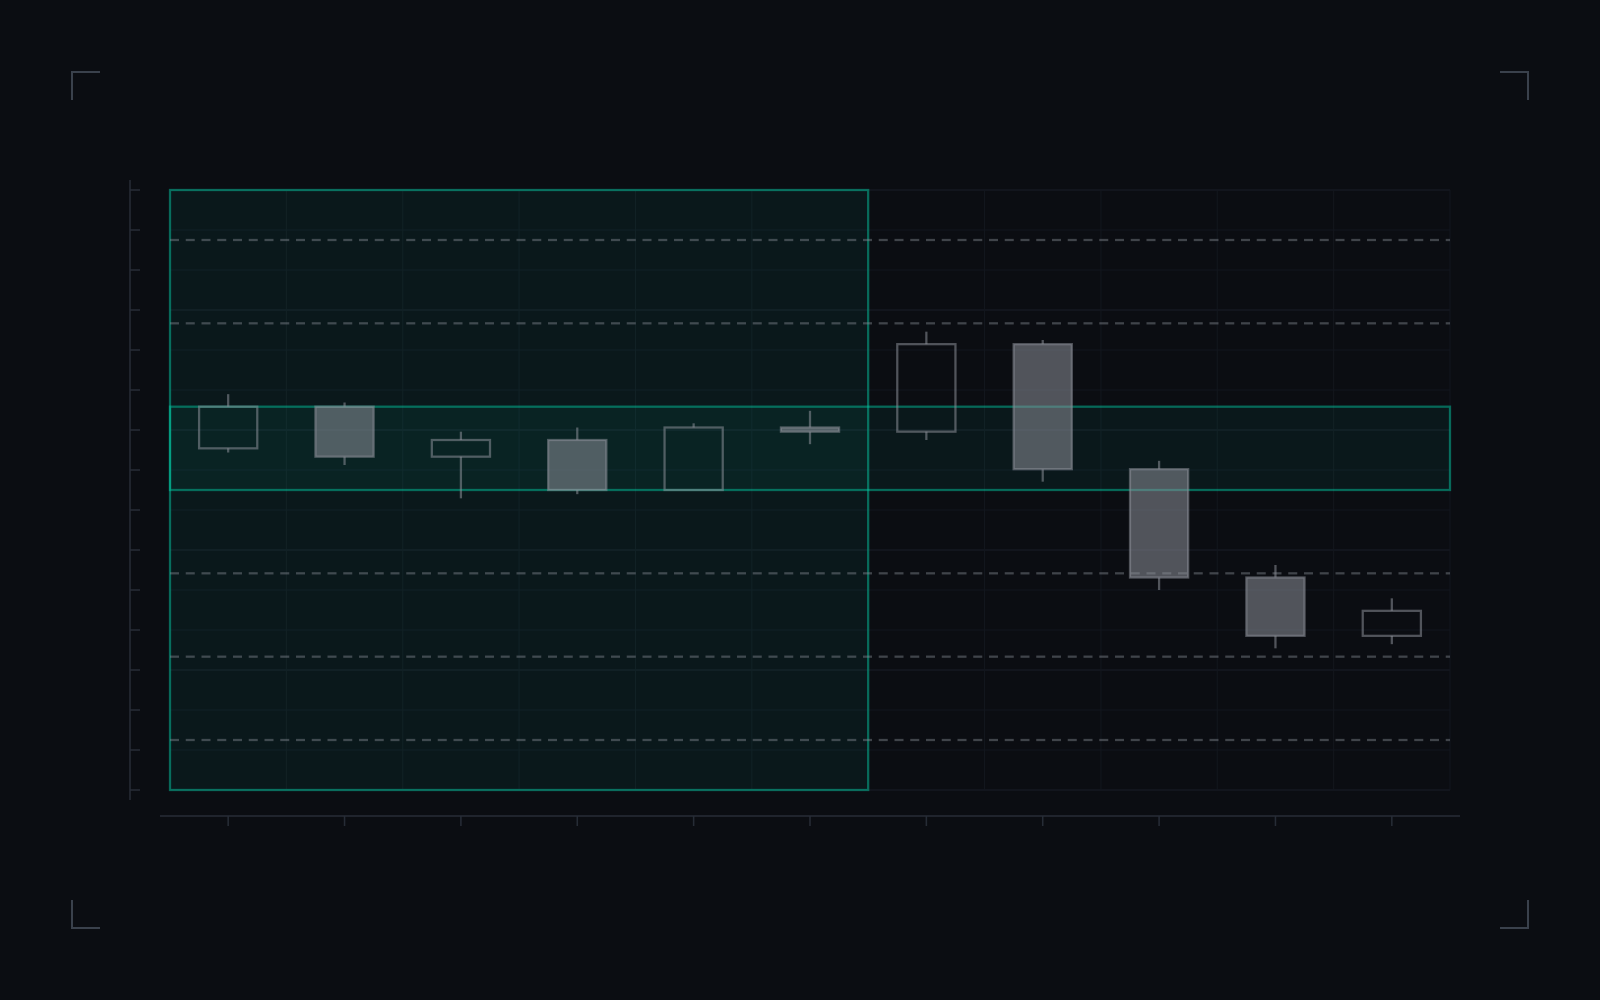
- 14:00 to 20:00 New York time, the window the range is measured in.
- The dealers range, from the highest to the lowest candle body in the window. The wicks beyond it are left out under the body election.
- The deviations: copies of the range’s height stacked above and below it, one and two above, one to three below.
- The next day, read as a sell day: its high forms inside the first deviation above, and its low reaches toward the second below.
The range and its ladder: six hours of candles, the band their bodies span, copies of its height stacked above and below it, and a sell day whose high stops inside the first deviation above and whose low reaches toward the second below.
Drawing the ladder establishes where the lines are. It does not establish that a day’s extremes favour them over lines drawn from any other window.
Central bank dealers range (CBDR): what the definition states, in full.
| Element | What the definition states |
|---|---|
| Window | 14:00 to 20:00, New York time. |
| RangeWicks by election; the common teaching prefers bodies. | Highest to lowest candle body in the window. |
| Size ruleSources disagree on the ideal: 20 to 30 pips in one, 10 to 20 in another. | Under 40 pips. |
| DeviationsCalled standard deviations; not the statistical measure of that name. | Multiples of the range’s height above the high and below the low. |
| Not established | That the next day’s extremes land near these lines more often than near lines projected from other windows. |
Commonly confused with
Neighbouring concepts that get used interchangeably, and the distinction that actually separates them.
- Asian range
The Asian range is the range traded from 20:00 to midnight New York time, directly after the dealers range closes. Taught intraday profiles use the two together, and they are easy to mix up because one ends where the other begins.
- Standard deviation
The statistical standard deviation measures how widely values spread around their mean. The dealers range's deviations are copies of the range's own height stacked above and below it. They share the name and nothing else.
- PD array
A PD array is a zone read against the halves of a dealing range, the span between a swing high and a swing low. The central bank dealers range is a window of the clock, measured fresh each day, and despite the similar name it is not that dealing range.
- Kill zones
Kill zones are the windows the method acts in. The dealers range is a window it measures and projects from, and it closes at 20:00, as the Asian kill zone opens.
How to measure it in your own data
A definition you cannot test is a definition you have to take on trust. This is the shortest honest route from the concept to a number you computed yourself.
- Records you need
Intraday data in New York time covering 14:00 to 20:00 each trading day, the body-or-wick election, and the instrument's pip size, since the size rule is written in pips.
- What you compute
Each day, take the highest and lowest body prices (or wick prices, by election) between 14:00 and 20:00; the height is their difference. Deviation lines sit at the high plus one, two and three heights and at the low minus the same. Record where the next day's high and low land, in deviations, and compare that distribution with the same projection built from six-hour windows at other times of day.
- What the answer tells you
A narrow box across the New York afternoon and evening, with evenly spaced lines above and below it. A day whose high or low lands near one of the lines is the taught picture; with lines at even spacing, some line is always nearby, which is why the landing has to be compared with a baseline.
Questions and answers
What is the CBDR in ICT?
The range price trades between 14:00 and 20:00 New York time, usually measured on candle bodies. ICT teaching stacks copies of its height above and below it, calls them standard deviations, and reads them as the likely limits of the next day's high and low.
What does CBDR stand for?
Central bank dealers range, in the sources that spell it out. Many pages and searches write central bank dealing range for the same thing. Both name the 14:00 to 20:00 New York range.
What time is the CBDR?
From 14:00 to 20:00 New York time. While New York is on standard time that is 19:00 to 01:00 UTC, and 00:30 to 06:30 the next morning in India; while New York is on daylight time it is 18:00 to 00:00 UTC, and 23:30 to 05:30 in India.
How big should the CBDR be?
Under 40 pips in the common teaching, with sources differing on the ideal: one says 20 to 30 pips, another 10 to 20. A wider range is treated as unusable for projections that day. Because the threshold is in pips, it means different things in different pairs.
How do you use CBDR standard deviations?
Add the range's height above its high and subtract it below its low, one, two and three times. On a day read as a sell day, teaching expects the day's high within one or two deviations above the range; on a buy day, the low within one or two below. The day's other extreme is projected further, as far as the third deviation.
Do CBDR projections work?
The projection is arithmetic; the claim is that the next day's extremes land at the lines more often than chance allows. With lines evenly spaced, some line is always close, so a test compares the landings with projections from windows at other hours. The dealers range driver has a row in the claims ledger.
Related terms
Derived from the links this entry makes and the entries that link back to it.