47 / 97
IPDA (interbank price delivery algorithm)
Working definition
ICT's name for the premise that price is delivered by an interbank algorithm between pools of liquidity and imbalances, and for the part of it that can be computed: the highs and lows of the last 20, 40 and 60 trading days, treated as the levels that delivery references.
Behind the vocabulary of gaps and blocks sits a claim about what moves price, and the interbank price delivery algorithm is its name.
The premise, as the teaching states it
In ICT teaching, price is not simply discovered by buyers and sellers meeting; it is delivered, moved with intent from pools of resting orders on one side to imbalances such as fair value gaps on the other. Every move is read as doing one of two jobs: taking liquidity, or rebalancing an imbalance. The teaching attributes that delivery to an algorithm run in the interbank market, and adds that its direction shifts roughly every quarter.
None of that can be confirmed from public data. There is no published algorithm and no way to observe one from prices alone, and the premise is best read as the teaching’s account of why its objects should matter. What can be computed, and tested, are the data ranges that come with it.
The data ranges
The IPDA data ranges are rolling lookbacks on daily candles:
- The 20-day range: the highest high and lowest low of the last 20 trading days.
- The 40-day range: the same over 40 trading days.
- The 60-day range: the same over 60 trading days.
Because each longer window contains the shorter ones, the ranges nest: the 60-day high is never below the 40-day high, and the 60-day low is never above the 40-day low. Each range’s midpoint splits it into a premium half above and a discount half below, the same halves a PD array is sorted by. One published summary maps the three lengths to short, intermediate and long-term delivery.
A worked case, with constructed numbers, on daily EUR/USD. Over the last 20 trading days the high is 1.0960 and the low 1.0842; over 40, 1.0995 and 1.0842; over 60, 1.1030 and 1.0788. The midpoints are 1.0901, 1.09185 and 1.0909. With price at 1.0880, it sits in the discount half of all three ranges. The 20-day high at 1.0960 is the nearest buy-side extreme, and the low at 1.0842, shared by the 20 and 40-day ranges because the lowest price of the last 40 days printed inside the last 20, is the nearest sell-side one.
Reading price inside the ranges
Teaching reads the extremes as buy-side and sell-side liquidity: the orders resting above the range highs and below the range lows. A price in the discount half of the ranges is read as more likely to be delivered up toward the highs, and a price in the premium half as more likely to fall toward the lows, a reading that has to agree with the higher-timeframe structure before the method acts on it. The draw on liquidity is then chosen from these extremes and the other pools on the chart. The ranges supply candidates; they do not pick one.
The quarterly shift
The teaching also holds that delivery changes direction roughly every quarter. “Roughly” carries a great deal in that sentence: a shift that may arrive at any point within a few weeks of a date can be found after the fact in almost any price history. As a testable claim it needs a stated rule for what counts as a shift and when one is due, written down before the prices it is tested on.
The widest of the levels
The IPDA ranges are the widest of the reference levels the vocabulary measures a session against. Inside them sit the week’s and the day’s gaps, the new week opening gap and the new day opening gap; the opening range gap on index futures; and the central bank dealers range, which frames a single day. Read together they give a session a nested map, from a sixty-day range down to a six-hour one, and the daily bias is expected to agree with where price sits in the larger frames before the smaller ones are traded.
On lower timeframes
One published indicator also counts the same lookbacks in candles of a lower timeframe, such as the last 20, 40 and 60 hourly candles. That is the same arithmetic on a different clock. The ranges change with the timeframe, and a claim about lower-timeframe lookbacks is a separate claim from the one about daily ranges, with its own measurement. The teaching’s own statement of the ranges is in trading days.
Session conventions and the Sunday candle
A daily range depends on where each day starts and ends. Currencies and futures conventionally close the day at 17:00 New York time. Some currency feeds build daily candles on a server clock instead, and those feeds often print a short Sunday candle covering the first hours of the week. On such a feed twenty candles are not twenty trading days, and the ranges shift. The daily convention, and whether Sunday candles are merged or dropped, belong with any IPDA range quoted.
Computing it, step by step
- Choose the feed and the daily convention, and merge or drop short Sunday candles.
- Count back 20, 40 and 60 completed trading days, leaving out the day in progress.
- Take each window’s highest high and lowest low, and each midpoint.
- Extend the six extremes and three midpoints to the right.
- Recompute each day, since the windows roll and an extreme drops out of a range when its day leaves the window.
Common mistakes
Counting calendar days instead of trading days. Including the day in progress, so that the ranges move during the session. Mixing feeds with and without Sunday candles. Treating the interbank algorithm as established, when it is the premise the ranges are meant to test. And crediting the ranges whenever price reaches an extreme, when any rolling high or low is reached some of the time.
What the ranges do not settle
The ranges are exact once the feed and the daily convention are stated. Whether price reaches their extremes, or turns at their midpoints, more often than it reaches the extremes of other lookbacks is a measurement, and the data ranges driver has a row in the claims ledger, where that verdict renders. The two lenses keep the arithmetic, which is checkable, apart from the premise of an algorithm, which is not.
Where it sits in the ICT sequence
The ICT vocabulary in the order the method is taught, with a step for each kind of object.
- Step
- 02 of 08 Levels: the opens, gaps and ranges a session is measured from
- Also at this step
- New week opening gap (NWOG), New day opening gap (NDOG), Opening range gap (ORG), Central bank dealers range (CBDR)
- Before it
- Central bank dealers range (CBDR)
- After it
- Buy-side and sell-side liquidity
The shape, drawn
The smallest arrangement the definition admits. It is a drawing of a rule, not a reading of a market — nothing here is measured, and the table below it is the authoritative version.
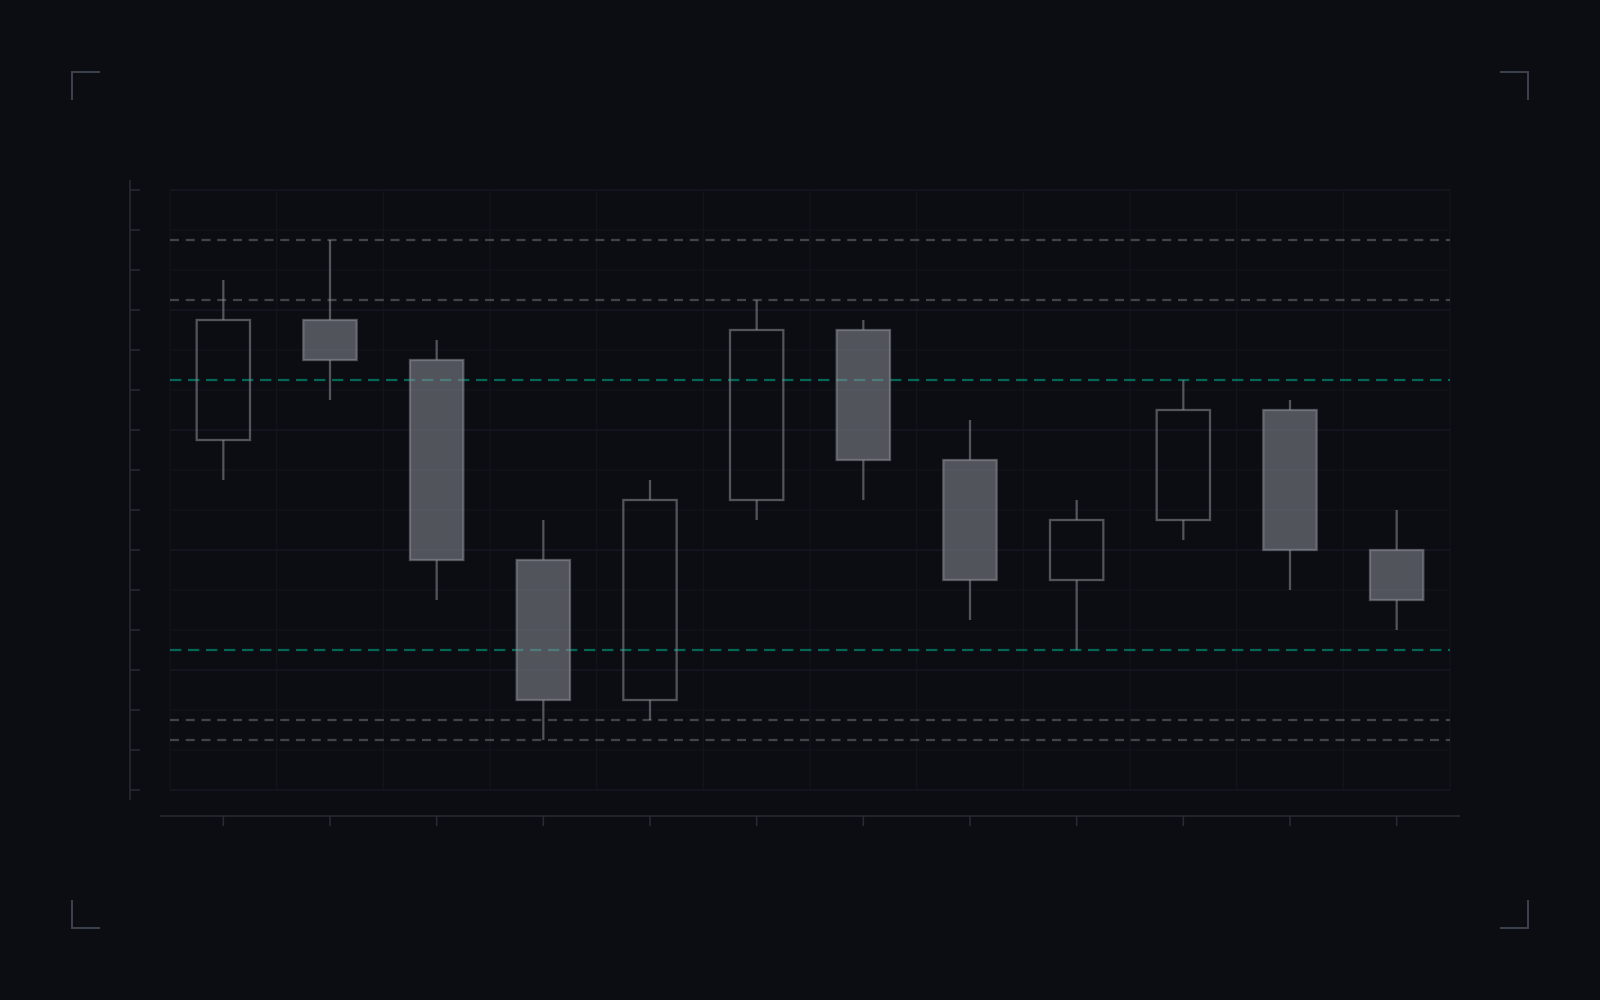
- The 20-day range: the highest high and lowest low of the last four candles, each candle standing for five trading days.
- The 40 and 60-day ranges: the same over the last eight candles and over all twelve. The ranges nest, so each is at least as wide as the one inside it.
Three lookbacks on one chart: the highs and lows of the last 20, 40 and 60 trading days, nested inside one another, with price in the discount half of the shortest range.
Drawing the ranges establishes where the rolling extremes sit. It does not establish that delivery is aimed at them, or that an algorithm exists.
IPDA (interbank price delivery algorithm): what the definition states, in full.
| Element | What the definition states |
|---|---|
| Lookbacks | 20, 40 and 60 completed trading days, on daily candles. |
| Extremes | The highest high and lowest low of each window. |
| Midpoints | Each range’s midpoint splits it into a premium half above and a discount half below. |
| Daily conventionThe daily close (17:00 New York for currencies and futures) and the handling of short Sunday candles change the ranges. | election pending |
| Not established | That price reaches these extremes more often than the extremes of other lookback lengths. |
Commonly confused with
Neighbouring concepts that get used interchangeably, and the distinction that actually separates them.
- PD array
A PD array is any of the zones the method reads for a reaction, such as a gap or a block, sorted by the half of the dealing range it sits in. The IPDA data ranges are three rolling windows of daily highs and lows: they locate price within a larger range rather than naming a zone to trade from.
- Draw on liquidity
The draw on liquidity is the pool price is expected to reach next, chosen from many candidates. The IPDA ranges supply six candidates, the 20, 40 and 60-day highs and lows, and say nothing by themselves about which one comes next.
- A Donchian channel
A channel of the highest high and lowest low over a lookback is an old construction, usually read for breakouts. The IPDA data ranges are the same arithmetic at three lengths, read instead as resting liquidity that delivery is expected to reach.
- Quarterly shifts
The IPDA teaching also says delivery changes direction roughly every quarter. That is a claim about timing; the data ranges are counted in trading days and do not depend on it.
How to measure it in your own data
A definition you cannot test is a definition you have to take on trust. This is the shortest honest route from the concept to a number you computed yourself.
- Records you need
Daily candles on a stated session convention, such as the 17:00 New York close for currencies and futures, with non-trading days removed so that 20, 40 and 60 count trading days, and the same feed throughout.
- What you compute
Each day, take the highest high and lowest low of the last 20, 40 and 60 completed trading days, and each range's midpoint. Record where price sits in each range and which of the six extremes it reaches first. Compare those rates with the same count for other lookback lengths, since any rolling high or low is reached some of the time.
- What the answer tells you
Three nested boxes to the left of price on a daily chart, each at least as wide as the one inside it, with their highs and lows extended to the right. Price reaching one of those lines is the taught picture; the useful question is whether 20, 40 and 60 days do better than 25, 50 or 75.
Questions and answers
What is IPDA in ICT?
The interbank price delivery algorithm: ICT's premise that price is delivered with intent between pools of resting liquidity and imbalances such as fair value gaps. Its computable part is the IPDA data ranges, the highs and lows of the last 20, 40 and 60 trading days.
What does IPDA stand for?
Interbank price delivery algorithm, in every published source that spells it out. The name describes the teaching's premise; what can be drawn and checked are the data ranges that go with it.
What are the IPDA data ranges?
The highest high and lowest low of the last 20, 40 and 60 trading days, measured on daily candles. Each range has a midpoint, which splits it into a premium half above and a discount half below.
How is IPDA used in trading?
As a map of the larger range. The 20, 40 and 60-day highs and lows are read as resting liquidity price may be delivered to, and price's position in each range, in its premium or discount half, is read alongside the bias. Entries still come from the smaller vocabulary, such as gaps and blocks, on lower timeframes.
Is there really an interbank algorithm?
Nothing in public data can confirm one. The claim that an algorithm run by banks delivers price is part of the teaching's story. The rolling highs and lows are ordinary arithmetic anyone can compute, and whether they matter is a question the data can answer.
Why 20, 40 and 60 days?
The teaching states those lengths, and published sources do not derive them. Twenty trading days is close to a calendar month and sixty close to a quarter. A test would compare them with other lengths before crediting these ones.
Can IPDA ranges be used on lower timeframes?
One published indicator applies the same lookbacks to lower-timeframe candles, such as the last 20, 40 and 60 hourly candles. That is the same arithmetic on a different clock, and a claim about it needs its own test; the teaching states the ranges in trading days.
Related terms
Derived from the links this entry makes and the entries that link back to it.