51 / 110
Internal and external range liquidity
Working definition
ICT's names for liquidity by its place relative to a stated dealing range: external range liquidity is the resting orders assumed beyond the range's swing high and swing low, and internal range liquidity is the unfilled imbalances inside it, most often fair value gaps. The teaching reads price as travelling between the two in turn.
A dealing range has an inside and an outside, and ICT teaching gives the liquidity in each a name and expects price to visit them in turn.
The range comes first
Both terms are defined against a dealing range: the span between a swing high and a swing low that contains price. Nothing about the pair can be read until that range is fixed, and fixing it takes three elections.
- The swings. Which swing rule makes a high or a low significant enough to bound the range. A three-bar fractal gives many small ranges; a swing that has itself taken liquidity, as one ICT tutorial requires, gives fewer and larger ones.
- The timeframe. One guide anchors the range one or two timeframes above the chart used for entries, a daily range for fifteen-minute entries, and uses session ranges intraday. Another marks the range on daily swings and applies the same reading on every timeframe.
- The update rule. When price closes beyond an edge and holds, the old range no longer contains price. A reading has to say when a new range replaces it and which swing becomes its new edge, or the edges can be moved to fit whatever followed.
The same range carries the premium and discount halves, split at its midpoint. That split and this one answer different questions: the halves say whether price is high or low inside the range, and internal and external say whether a target lies inside the range or beyond it.
External range liquidity
External range liquidity is the orders assumed to rest beyond the range’s edges: above the swing high, the buy stops of traders short from beneath it and the buy-stop entries of breakout traders; below the swing low, the mirror. In the language of buy-side and sell-side liquidity, the pool above the range is buy-side and the pool below is sell-side. One tutorial reads a cluster of equal highs or lows at an edge as a larger pool than a single swing, and sets the bias toward the larger of the two external pools.
Taking external liquidity has two outcomes, and the teaching needs both. Price trades beyond the edge and closes back inside, a liquidity sweep under that entry’s test, or it closes beyond and holds, a breakout that ends the range. The first outcome is the one the rotation expects; one guide adds that a raid is not traded as a reversal until price rejects it sharply or shifts structure on a lower timeframe.
Internal range liquidity
Internal range liquidity is the unfilled imbalance inside the range. Three of the four guides read for this entry name fair value gaps first. One tutorial counts nothing else and lists order blocks and breaker blocks among the mistakes; its reason is that a gap’s candles have highs and lows of their own on a lower timeframe, so a fill takes that smaller liquidity. One guide adds order blocks, breakers and minor equal highs and lows. Another counts minor swing points and short-term support and resistance inside the range.
The list is an election with a direct effect on any count. The wider it is, the more objects sit inside a given range, and the likelier it becomes that some internal target lies near wherever a pullback ends. A reading also has to state when a gap stops counting: a trade into it, a trade to its midpoint, the consequent encroachment, or a trade through its far edge. The worked case below turns on that rule.
The rotation, as taught
The teaching’s claim is a sequence. Price takes external liquidity on one side, returns into the range to an internal imbalance, and then runs out to external liquidity again. One tutorial describes the cycle as external, internal, external, internal, and says that knowing which leg is under way tells a trader whether to expect a correction or a directional move. One page attributes the rotation to algorithms that deliver price, the premise the IPDA entry describes, which nothing in public prices can confirm.
The guides qualify the claim. One says a genuine breakout ignores it. One tutorial says strong trends run through internal targets toward the next external pool without returning, and that the reading works best in ranging markets. Another says the idea cannot predict price on its own. One guide expects external raids inside the London and New York kill zones. The rotation also names the kind of the next target and not its side: after a fill inside the range, both edges are external, and the choice between them comes from the bias.
A worked case
Constructed numbers throughout. On a daily EUR/USD chart the dealing range runs from a swing low at 1.0800 to a swing high at 1.1000, 200 pips, with its midpoint at 1.0900. Inside it sits an unfilled bullish fair value gap from 1.0870, the first candle’s high, to 1.0895, the third candle’s low: 25 pips, with its midpoint at 1.08825, in the range’s discount half. The fill rule is a trade to the gap’s midpoint, and the elections are written before the next candle.
Price rallies to 1.1014, 14 pips beyond the swing high, and the day closes at 1.0985, back inside: external liquidity on the buy side, taken by a sweep. Over the following days price falls into the gap and trades to 1.0880, 15 pips into it and past its midpoint, so under the stated rule the internal liquidity is filled. Price then falls through the swing low to 1.0788, 12 pips beyond it: external liquidity on the sell side. Read as the teaching reads it, the sequence is external, internal, external.
Change one election and the reading changes. Under a fill rule that needs a trade through the gap’s far edge at 1.0870, the gap was never filled, and the run to 1.0788 skipped internal liquidity altogether. And had the day that reached 1.1014 closed at 1.1010 and the following days held above 1.1000, the range would have broken out: the old high would be external to nothing, and a new range, with a new internal list, would have to be drawn under the stated update rule before the next target could be named.
Using it, as taught
The pair supplies bias, entries and targets. For bias, one tutorial points at the larger external pool as the one price gravitates toward; one guide reads the pool taken most recently as a sign of which leg comes next. For entries, the teaching waits at a target: after an external raid, for a lower-timeframe market structure shift with displacement back into the range; at an internal imbalance, for the same confirmation in the direction of the bias, with the entry taken on the retracement the shift leaves. For targets, the next pool in the direction of the trade, internal or external, and not beyond it.
One tutorial also assigns timeframes: external liquidity read on fifteen-minute to four-hour charts, internal liquidity on fifteen- or five-minute charts, where one-minute gaps are too small and too frequent to use, and the trigger on a one- to five-minute chart. Each of these is an election, and a result for one set of them does not transfer to another.
Identifying them, step by step
- State the range timeframe and the swing rule, then mark the dealing range’s high and low and its midpoint.
- Write the update rule: what close beyond an edge ends the range, and which swing becomes the new edge.
- Mark external liquidity beyond each edge, noting clusters of equal extremes and which side’s pool is larger.
- Mark internal liquidity under the stated list, fair value gaps only or more, each with the fill rule that retires it.
- Record which kind of liquidity price reached last, and the target the rotation names next.
- Score the reading when price reaches a target, keeping the breakouts and the trends that skipped a leg in the record.
Common mistakes
Drawing the range after the move, from whichever swings frame it best. Counting every imbalance and block inside the range as internal liquidity, so that some target is always near. Changing the fill rule from one chart to the next. Reading every trade beyond an edge as a raid that will reverse, when a close beyond and a hold is a breakout. Moving the range’s edges after a breakout without a stated rule. And collecting the ranges that rotated while forgetting the ones price left and never revisited.
What the pair does not settle
The construction is exact once its elections are stated: a range from stated swings, pools beyond its edges, and a list of imbalances inside it with a fill rule, which two readers with the same data will mark identically. The teaching adds a claim about order.
Price is said to go from external liquidity to internal liquidity and back more often than chance allows. Each half of that is a count: how often a trade beyond an edge is followed within a stated horizon by a fill inside the range, and how often a fill is followed by a trade beyond an edge, each set beside the same counts for prices chosen at random inside the range. Ranges drawn on a larger timeframe hold many imbalances and every pullback ends somewhere, so a count that picks its range or its gap afterwards will find the rotation on almost any chart. The rotation-state driver has a row in the claims ledger, where that verdict renders. The draw on liquidity entry sets out the target-choosing half of the idea, and the two lenses keep the map of the range, which anyone can draw, apart from the claim about the order in which price visits it.
Where it sits in the ICT sequence
The ICT vocabulary in the order the method is taught, with a step for each kind of object.
- Step
- 03 of 08 Liquidity: the resting orders, and whether price has taken them
- Also at this step
- Buy-side and sell-side liquidity, Equal highs and lows, Draw on liquidity (DOL), ICT daily bias, Liquidity sweep, Inducement, Judas swing, Turtle soup, Candle range theory (CRT), SMT divergence
- Before it
- Draw on liquidity (DOL)
- After it
- ICT daily bias
The shape, drawn
The smallest arrangement the definition admits. It is a drawing of a rule, not a reading of a market — nothing here is measured, and the table below it is the authoritative version.
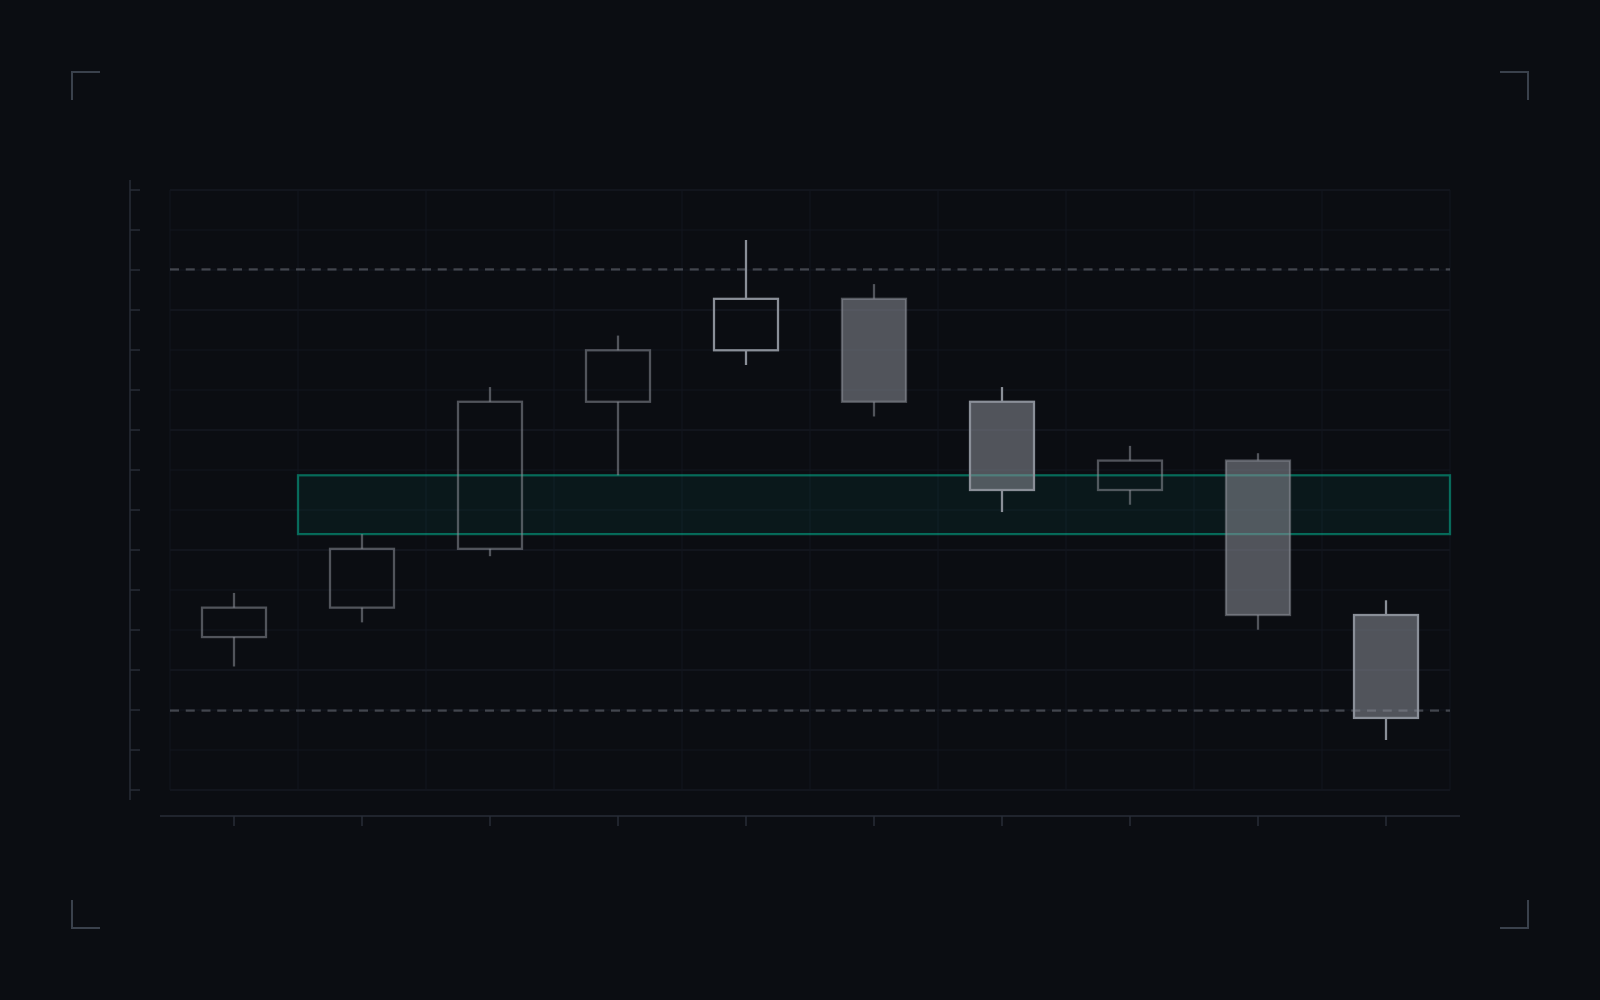
- The dealing range’s high and low, fixed from swings before the drawing starts. External range liquidity rests beyond each.
- Internal range liquidity: an unfilled fair value gap inside the range, between the first candle’s high and the third candle’s low.
- Rising candles, including the three that leave the gap.
- External, buy side: a candle trades above the range high and closes back beneath it.
- Falling candles between the targets.
- Internal, then external: one candle is the first to trade into the gap, past its midpoint; the last trades through the range low.
The rotation the teaching describes, on one dealing range: price trades above the range high and closes back beneath it, falls into the unfilled fair value gap inside the range past its midpoint, then runs out through the range low.
The drawing establishes how the range, its external pools and its internal gap are marked, and the order in which price reached them here. It does not establish that price visits them in that order more often than chance allows.
Internal and external range liquidity: what the definition states, in full.
| Element | What the definition states |
|---|---|
| Range | Between a stated swing high and swing low, on a stated timeframe. |
| External | The resting orders assumed beyond the range high and the range low. |
| InternalGuides disagree on the list: fair value gaps only, or blocks and minor extremes too. | Unfilled imbalances inside the range. |
| Fill ruleA trade into the gap, to its midpoint, or through its far edge. | election pending |
| Update ruleWhich range replaces this one once price closes beyond an edge and holds. | election pending |
| Not established | That price visits external and internal liquidity in turn more often than chance allows. |
Commonly confused with
Neighbouring concepts that get used interchangeably, and the distinction that actually separates them.
- Buy-side and sell-side liquidity
Buy-side and sell-side name a pool by its side of price: above it or below it. Internal and external name it by its place against a stated range. Every external pool is buy-side or sell-side liquidity, but a minor high inside the range is buy-side liquidity and still internal to that range.
- Fair value gap
A fair value gap is an object with a three-candle test. Internal range liquidity is a role a gap plays when it lies inside a stated range and is still unfilled. The same gap is internal to one range and outside another, and it stops counting once it is filled.
- Premium and discount
The premium and discount halves split a dealing range at its midpoint, above and below. Internal and external split the same range into inside and beyond. A gap in the discount half is internal; the orders beneath the range low are external.
- Draw on liquidity
The draw is the level price is expected to reach next. The internal and external rotation is one rule for choosing it: after external liquidity is taken, an internal target; after an internal fill, an external one. It names the kind of target, not its side.
- Internal and external structure
Structure terms grade swings: an internal swing sits inside a larger swing, and a break of it is a lesser event. Range liquidity terms locate orders and imbalances against one range. A chart can carry both readings at once, and they answer different questions.
How to measure it in your own data
A definition you cannot test is a definition you have to take on trust. This is the shortest honest route from the concept to a number you computed yourself.
- Records you need
Candle data at two declared timeframes, one for the range and one for execution; the swing rule that fixes the range's high and low, and the rule that replaces the range once price breaks out of it; the rule for which imbalances count as internal and when one is filled; the rule for the pools beyond each edge; and the feed.
- What you compute
Register each range and its internal imbalances as they form, never after. Record the order in which price reaches them: whether a trade beyond an edge is followed within a stated horizon by a fill inside the range, and whether a fill is followed by a trade beyond an edge. Compare with the same counts for prices chosen at random inside the range, and repeat under the neighbouring fill and update rules.
- What the answer tells you
A range with an old high above it, an unfilled gap inside it, and price travelling from the high to the gap and then out through the low. Ranges contain gaps almost everywhere and every leg ends somewhere, so the picture fits most charts once the range is chosen after the move; a count needs the range and its update rule fixed first.
Questions and answers
What are internal and external range liquidity in ICT?
Names for liquidity by its place relative to a dealing range. External range liquidity is the orders assumed to rest beyond the range's swing high and swing low. Internal range liquidity is the unfilled imbalances inside the range, most often fair value gaps. The teaching expects price to reach one and then the other, in turn.
What counts as internal range liquidity?
Guides disagree. One ICT tutorial counts only unfilled fair value gaps and calls order blocks a common mistake; one guide adds order blocks, breakers and minor equal highs and lows; another counts minor swing points inside the range. Which objects count is an election, and it changes how often price can be said to have reached internal liquidity.
How does price move between internal and external liquidity?
As taught, in rotation: a run to external liquidity on one side, a return into an internal imbalance, then a run to external liquidity again. Two guides add that a genuine breakout or a strong trend ignores the rotation, so it is a claim about frequencies, and the chart alone does not settle it.
Which timeframe is the dealing range drawn on?
No single one. One guide anchors the range one or two timeframes above the entry chart, such as a daily range for fifteen-minute entries; another marks it on daily swings and applies the idea on every timeframe. Whichever is used, the range and the rule that replaces it after a breakout are stated before the chart is read.
Does the internal and external rotation work?
No definition can say. The count registers each range and its imbalances as they form, then records how often a trade beyond an edge is followed by a fill inside the range within a stated horizon, and a fill by a trade beyond an edge, against the same counts for prices chosen at random inside the range.
Related terms
Derived from the links this entry makes and the entries that link back to it.