70 / 97
PD array
Working definition
Short for premium and discount array: any of the reference zones ICT reads as places price may react, sorted by which half of the dealing range it sits in. Arrays in the discount half are read as buying areas, and arrays in the premium half as selling areas.
Every zone in the ICT vocabulary answers where price might react, and the PD array is the name for all of them sorted by one further question: which half of the range are they in?
Premium, discount and the range
The sorting starts from a dealing range, bounded by a swing high and a swing low under a stated rule. Its midpoint is the equilibrium. Everything above the equilibrium is premium and everything below it is discount. Price in the premium half is read as expensive relative to the range, and price in the discount half as cheap. The premium-discount and OTE indicator draws exactly this split, with the range anchored by the same swing rule the structure tools use.
A PD array, a premium or discount array, is a reference zone read through that split. A bullish array in the discount half is treated as a place to look for buying; a bearish array in the premium half as a place to look for selling. The zone itself is defined on its own page; what the PD array adds is the position in the range.
What counts as an array
The members are the zones the rest of the vocabulary defines. Listings share a core: the fair value gap, the order block, the breaker block, the rejection block, the propulsion block and the optimal trade entry band, each in a bullish and a bearish form. Beyond that core they differ. One published matrix counts eight array types in each direction, another lists six, and some include further zones. A PD array statement that does not say which list it uses cannot be reproduced, because a different list marks different zones.
The matrix and its timeframes
The PD array matrix arranges the types in each half and, in most teaching, ranks them, so that some arrays are preferred over others when several sit near price. The arrays are also nested across timeframes. A higher-timeframe array, a daily gap or a four-hour block, supplies the location where a move is expected to react, and the entry sequence is then read on a lower timeframe inside that location.
A worked picture, constructed. A dealing range runs from 1.0800 to 1.0900, so its equilibrium is 1.0850. A bullish gap sits at 1.0815 to 1.0822, in the discount half; a bearish order block sits at 1.0880 to 1.0890, in the premium half. With a bullish bias the gap is the array of interest as a buying area, and the block above equilibrium marks where selling would be expected on the way up. With a bearish bias the roles reverse.
When the range moves
A dealing range is not fixed. When price breaks beyond the range’s high or low and a new swing forms, the range is redrawn, the equilibrium moves with it, and an array that sat in the discount half of the old range can sit in the premium half of the new one without price ever touching it. That makes the range’s anchoring rule the most consequential election in the framework: it decides, for every array on the chart, which reading it receives.
Arrays that straddle equilibrium raise the same question from the other side. A gap that spans the midpoint sits partly in each half, and teaching treats such zones inconsistently: some versions assign them by their own midpoint, some by the half holding most of the zone, and some leave them out. Whichever rule is chosen has to be fixed before the arrays are read, or the half can be assigned after the reaction is known.
Reading an array with the draw
Arrays are rarely read alone. The draw on liquidity names where price is expected to travel, and the array names where the journey is expected to begin. A bullish reading wants a discount array beneath price and a draw above it; a bearish reading wants the reverse. An array in the correct half with no draw beyond it is a zone without an objective, and a draw with no array in the correct half is a destination with no stated entry. Stated together they make one forecast that can be scored: price reacts at the array and reaches the draw, in that order, within a stated horizon.
What the matrix owes
The framework makes three separate claims, and each can be tested on its own. The half matters: arrays in the half that agrees with the bias react more often than the same array types in the other half. The types differ: some arrays react more reliably than others. And the ranking holds: the published order of preference matches the order the data produces. The detector campaign registers the array registry and a comparison of the measured ordering with the published one as a single driver, with its row in the claims ledger, where the verdict renders. The two lenses keep the sorting, which is arithmetic on a range, apart from the three claims built on it.
Where it sits in the ICT sequence
The ICT vocabulary in the order the method is taught, with a step for each kind of object.
- Step
- 07 of 08 Range: where in the dealing range an entry sits, and at what retracement
- Also at this step
- Optimal trade entry (OTE)
- Before it
- Propulsion block
- After it
- Optimal trade entry (OTE)
The shape, drawn
The smallest arrangement the definition admits. It is a drawing of a rule, not a reading of a market — nothing here is measured, and the table below it is the authoritative version.
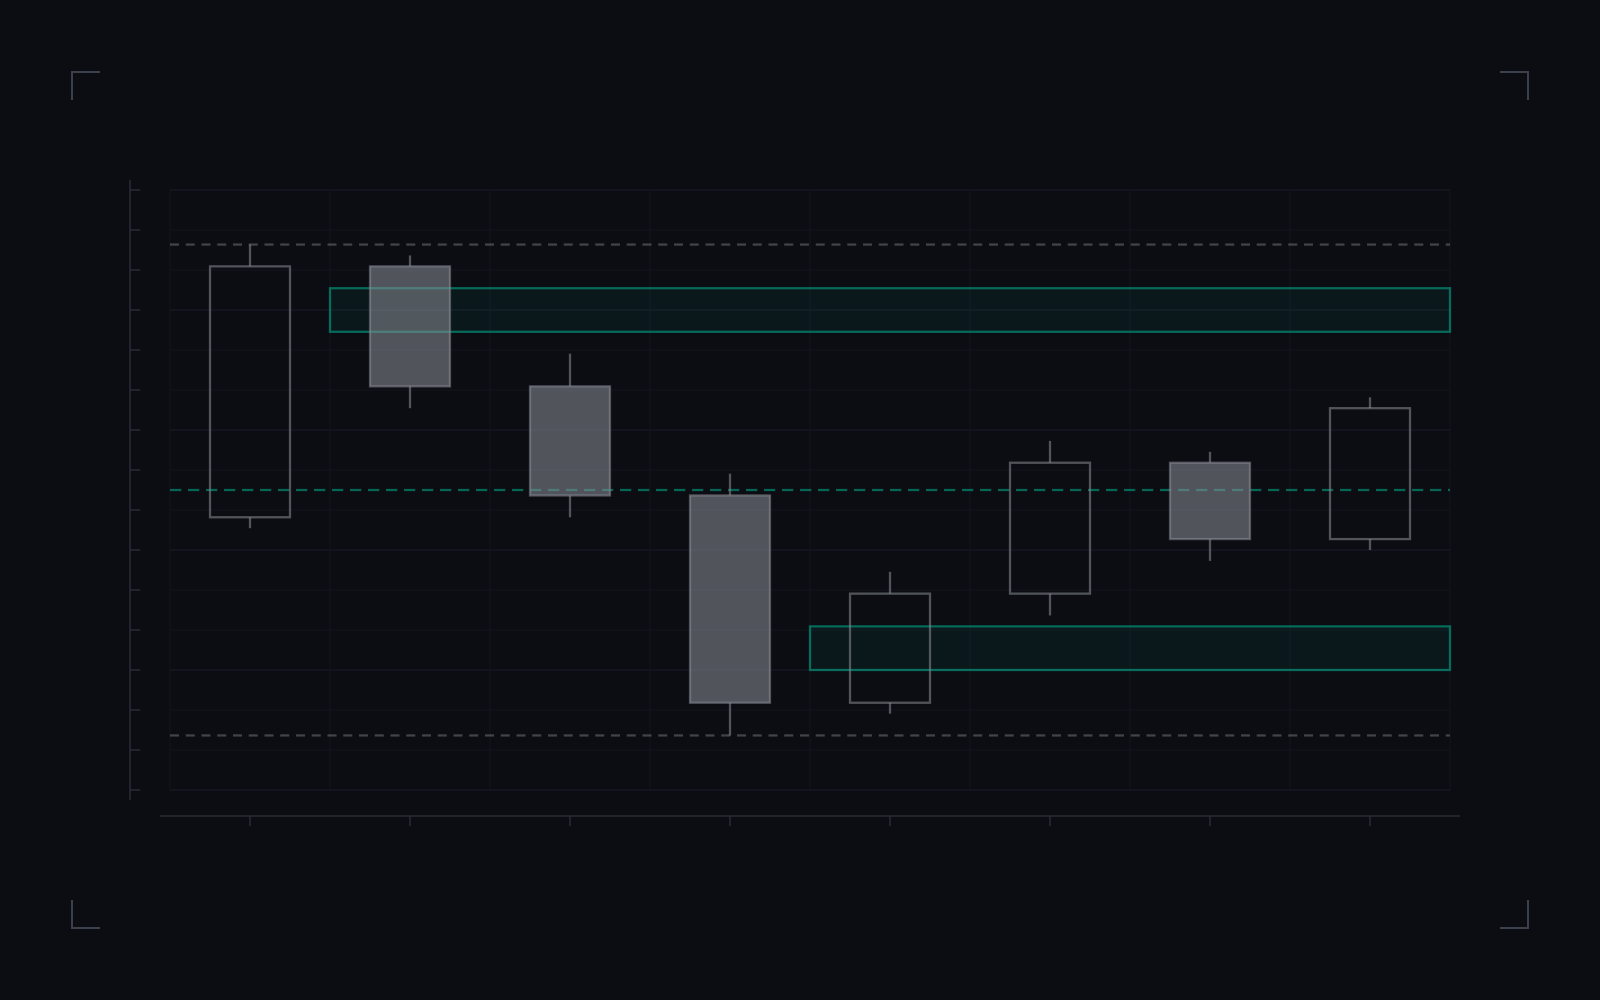
- Equilibrium, the midpoint of the dealing range at 5.5: premium above it, discount below.
- The range’s high at 10 and low at 1, the swings the split is anchored to.
- A bullish array in the discount half and a bearish array in the premium half, each read through the half it sits in.
- The price series inside the range.
A dealing range split at its equilibrium, with one array in each half: the discount half’s bullish zone read as a buying area and the premium half’s bearish zone as a selling area.
Sorting arrays by half establishes where each one sits. It does not establish that the half, the array type or the published ranking changes how price reacts.
PD array: what the definition states, in full.
| Element | What the definition states |
|---|---|
| Dealing rangeWhich swing high and low bound it, on which timeframe. | election pending |
| Equilibrium | The midpoint of the range. |
| Discount half | Below equilibrium; bullish arrays there are read as buying areas. |
| Premium half | Above equilibrium; bearish arrays there are read as selling areas. |
| Array typesPublished matrices differ in how many types they include and in their order. | A stated list. |
| Not established | That the half, the type or the published ranking changes how price reacts. |
Commonly confused with
Neighbouring concepts that get used interchangeably, and the distinction that actually separates them.
- Optimal trade entry
Optimal trade entry is one retracement band inside a single leg. A PD array is any qualifying zone, sorted by which half of the whole dealing range it occupies. The band is usually looked for where it overlaps an array in the half that agrees with the bias.
- Order block
An order block is one kind of PD array. The PD array is the category: order blocks, fair value gaps, breaker blocks, rejection blocks, propulsion blocks and the other zones of the vocabulary, read together through their position in the range.
- Support and resistance
Support and resistance are levels that earned their status from past touches. PD arrays are zones selected by definition before any touch, and their buying or selling reading comes from which half of the range they sit in, not from history at the level.
- Draw on liquidity
The draw is the destination price is expected to reach. A PD array is a place price is expected to react. Teaching pairs them: an array in the discount half as the entry, a draw above as the objective.
How to measure it in your own data
A definition you cannot test is a definition you have to take on trust. This is the shortest honest route from the concept to a number you computed yourself.
- Records you need
Candle data at the timeframes the arrays and the dealing range are read on; the rules for each array type; the rule that anchors the dealing range's high and low; and the published ordering of array types, if the ordering itself is under test.
- What you compute
Build the registry of arrays under their rules and label each by the half of the current dealing range it sits in. Record returns into each array and what followed. Compare discount-half arrays with premium-half arrays of the same type, each type with the others, and the published ordering of types with the ordering the data produces.
- What the answer tells you
A dealing range split at its midpoint, with gaps and blocks marked in each half, and entries sought only in the half that agrees with the bias. The picture is tidy; the measurable questions are whether the half matters, whether the array types differ, and whether the ranking teaching gives them survives a count.
Questions and answers
What is a PD array in ICT?
A premium or discount array: a reference zone such as a fair value gap or an order block, read through its position in the dealing range. Arrays in the lower, discount half are treated as places to look for buying; arrays in the upper, premium half as places to look for selling.
What does PD mean in trading?
In ICT usage, premium and discount: the upper and lower halves of a dealing range. A PD array is a zone read through that split, and the PD array matrix is the name for the arrays arranged by type and by half.
What are the types of PD arrays?
Listings differ, but they share a core: fair value gaps, order blocks, breaker blocks, rejection blocks, propulsion blocks and the optimal trade entry band, each in a bullish form for the discount half and a bearish form for the premium half. The count and the ordering vary between sources, which is a reason to state which list is in use.
What is the PD array matrix?
An arrangement of array types in each half of the dealing range, often with an order of preference between them. The ordering is teaching, not measurement, and comparing it with the ordering the data produces is one of the most direct tests the vocabulary offers.
What does a higher-timeframe PD array represent?
A zone drawn on a larger timeframe, used as the place a move on a smaller timeframe is expected to reach or react at. The higher timeframe supplies the location; the lower timeframe supplies the entry sequence.
How is the premium and discount split drawn?
Between the dealing range's high and low, at its midpoint, the equilibrium. Above it is premium and below it discount. The range's anchors are an election: which swing high and low bound it, and on which timeframe.
Related terms
Derived from the links this entry makes and the entries that link back to it.
Where the term is in build
Detector datasheets whose concepts include this term, or whose published copy uses it. Each one states the build state it has reached and the parameters it exposes, and carries no measured verdict.