42 / 97
ICT weekly profiles
Working definition
Templates for when in the trading week the week's high and low form, such as a Tuesday low in a bullish week or a Thursday reversal after a quiet start. ICT teaching uses them to anticipate the rest of a week from its first days.
Every week makes a high and a low on some day, and ICT’s weekly profiles are named expectations about which days those will be.
What a profile describes
A profile starts from a clock. The week runs from the Sunday open to the Friday close on New York time, and within it the week’s high and low each print on one day. A weekly profile is a template for that pattern: the day the low forms, the day the high forms, which comes first, and what the days in between look like. A bullish profile puts the low early and the high late; a bearish profile does the reverse. Teaching reads the first days of a week against these templates and uses the one that fits to anticipate the rest.
The twelve templates
The commonly taught set has twelve profiles, six families each in a bullish and a bearish form:
- Classic Tuesday low or high of the week: the extreme against the week’s direction forms on Tuesday, after a Monday that drifts or dips toward a higher-timeframe array.
- Wednesday low or high of the week: the same shape with the turn a day later.
- Consolidation Thursday reversal: the early week holds in a range, and Thursday breaks one side and reverses.
- Consolidation midweek rally or decline: a quiet start, then the week’s move runs from the middle of the week.
- Seek-and-destroy Friday: a week that runs both sides of its range before the close.
- Wednesday weekly reversal: a week that trends into Wednesday and then turns for the rest of it.
Listings name the families with small differences in wording, and the shapes above are the core they share. The detector campaign treats the twelve templates as labels and measures the timing of weekly extremes directly, which is the right order: the labels describe, the timing counts.
How a profile is chosen
As taught, a profile is chosen in stages. Before the week, a higher-timeframe bias and a draw on liquidity set the expected direction. Monday and Tuesday are then read against nearby PD arrays and the liquidity resting around them: an early dip into a discount array that holds supports a Tuesday-low template, while an early week that holds a range points toward a consolidation template. Inside each day the same reading continues at a finer scale, through the kill zones and, at the open, the judas swing.
What makes the process checkable is its decision point. A template chosen at the Tuesday close, from what was known at the Tuesday close, can be scored against the rest of the week. A template chosen on Friday, looking back, fits every week and forecasts nothing.
Profiles that change mid-week
A template chosen on Tuesday can be contradicted on Wednesday. Teaching treats that as information: a week that was reading as a classic Tuesday low and then trades beneath Tuesday’s low on Wednesday is re-read as a Wednesday low, or as a consolidation that has not yet resolved. The flexibility is useful to a reader and costly to a test, because a rule that may switch templates after the fact will always end the week holding a template that fits. A fair measurement fixes both the decision points and the rule for switching, and scores the template that was active at each decision point rather than the one the finished week most resembles.
Why the base rate decides
Weekly extremes do not form evenly across the days. The days that host a week’s high or low have their own distribution, measurable from many weeks of data, and early-week extremes are common in it. That is exactly why a classic Tuesday-low week is easy to find in hindsight. The question a profile has to answer is whether selecting it in advance does better than selecting templates in proportion to how often each shape occurs anyway. The weekly-profile driver’s row in the claims ledger is where that verdict renders, and the two lenses keep the templates, which are descriptions of weeks, apart from the forecast drawn from them.
Where it sits in the ICT sequence
The ICT vocabulary in the order the method is taught, with a step for each kind of object.
- Step
- 01 of 08 Time: the hours the method watches
- Also at this step
- Kill zones (ICT), ICT macro times
- Before it
- ICT macro times
- After it
- New week opening gap (NWOG)
The shape, drawn
The smallest arrangement the definition admits. It is a drawing of a rule, not a reading of a market — nothing here is measured, and the table below it is the authoritative version.
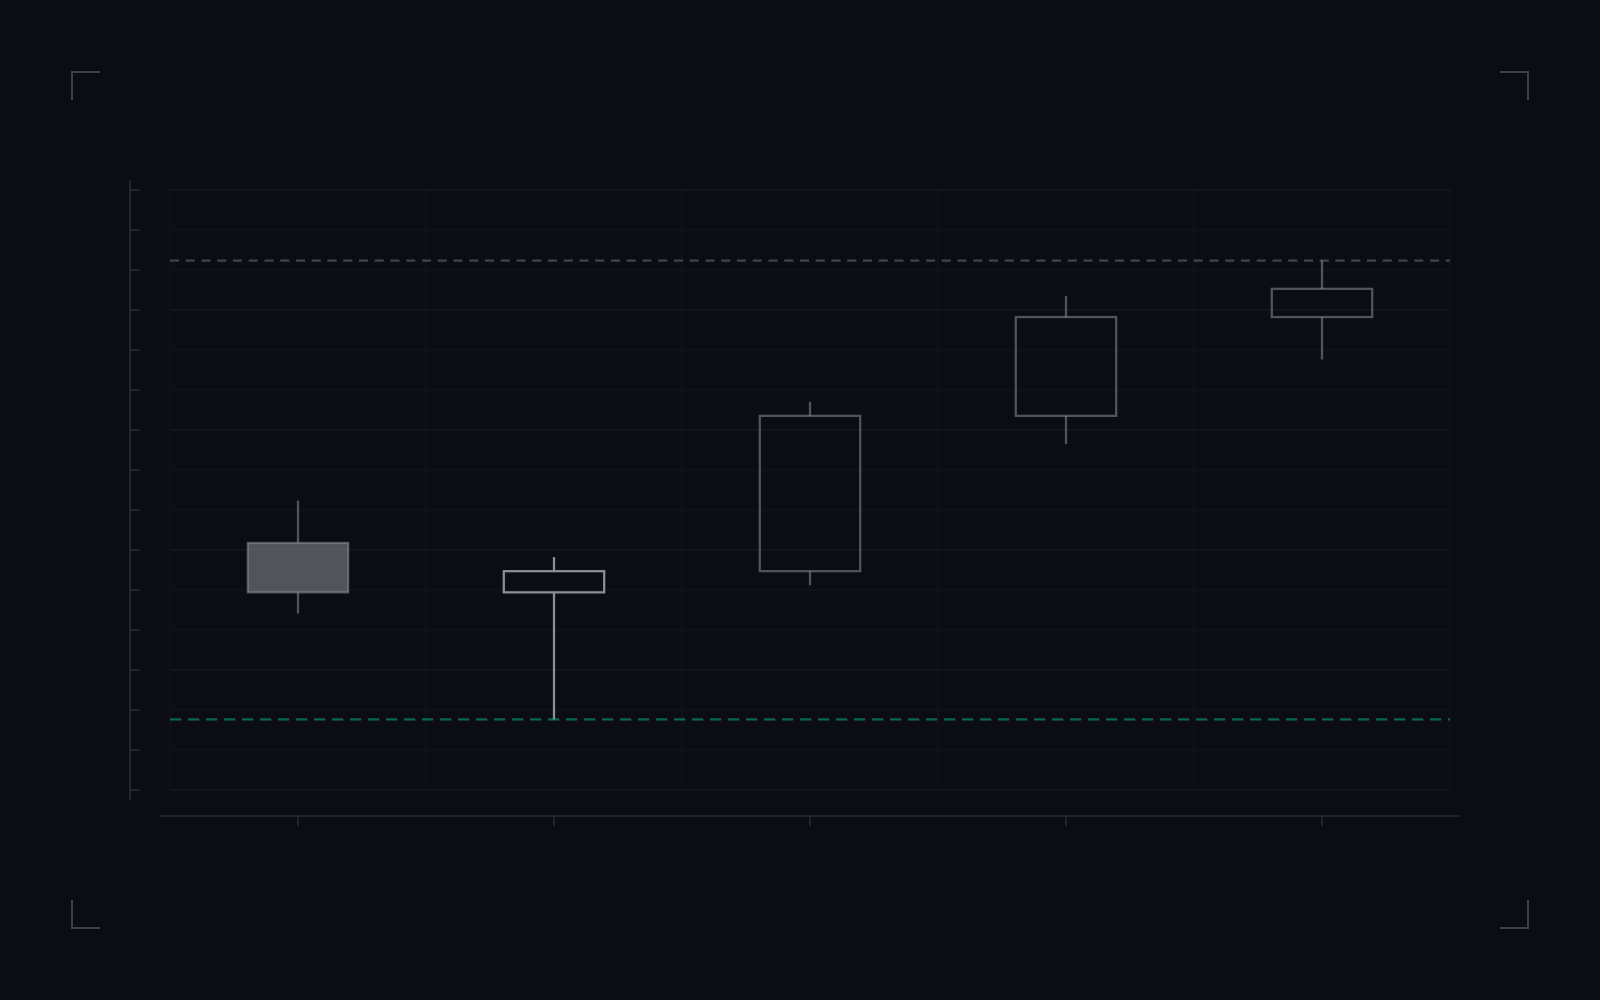
- Monday drifts lower.
- Tuesday prints the week’s low and closes back up.
- Wednesday to Friday carry the week’s move; the high forms late.
- The week’s low, on Tuesday.
- The week’s high, on Friday.
The classic Tuesday low of the week, drawn as five daily candles: Monday drifts, Tuesday prints the week’s low, and the rest of the week carries price to a late high.
Drawing a template establishes what one week of that shape looks like. It does not establish that choosing the template by Tuesday’s close beats choosing by how often each shape occurs.
ICT weekly profiles: what the definition states, in full.
| Element | What the definition states |
|---|---|
| Week | Sunday open to Friday close, New York time. |
| Templates | Twelve: six families, each in a bullish and a bearish form. |
| This drawing | The classic Tuesday low of the week, bullish. |
| Decision pointThe moment the template is chosen, using only what was known then. | election pending |
| Base rate | The measured distribution of the days weekly highs and lows form on. |
| Not established | That choosing a template in advance beats choosing by that base rate. |
Commonly confused with
Neighbouring concepts that get used interchangeably, and the distinction that actually separates them.
- Day-of-week seasonality
Seasonality is the measured distribution of the days on which weekly highs and lows form, computed from many weeks. A weekly profile is a named template chosen for the current week. The template is a forecast; the distribution is the base rate the forecast has to beat.
- Kill zones
Kill zones divide a day into windows. Weekly profiles divide a week into days. Both are time labels on the New York clock, and neither contains an effect until one is measured against ordinary seasonality.
- Power of three
Power of three reads one candle, whether a day or a week, as open, manipulation, extreme and close. A weekly profile names the day the week's extreme is expected on. A weekly power-of-three reading and a Tuesday-low profile can describe the same week from two angles.
- Judas swing
The judas swing is an intraday event at a session open. A weekly profile is a template for the whole week, in which an early-week move against the week's direction plays a similar role at a larger scale.
How to measure it in your own data
A definition you cannot test is a definition you have to take on trust. This is the shortest honest route from the concept to a number you computed yourself.
- Records you need
Daily or intraday data with the week defined on a stated clock, usually from the Sunday open to the Friday close in New York time; the day on which each week's high and low printed; and the rule that assigns a week to a template, stated so that it can be applied before the week is over.
- What you compute
For many weeks, record the days on which the high and the low formed, which gives the base-rate distribution. Then, for each week, apply the template rule using only what was known at a stated decision point, such as the Tuesday close, and score whether the remaining days followed the chosen template. Compare that hit rate with choosing templates in proportion to their base rates.
- What the answer tells you
A week whose low printed on Tuesday and whose high came late, matching the classic bullish template. Such weeks are common, because early-week lows are common anyway; a profile earns its keep only if choosing it in advance beats choosing by the base rate.
Questions and answers
What are ICT weekly profiles?
Templates for the shape of a trading week: on which day the week's low and high are expected to form, and in what order. Teaching uses them to read the first days of a week and anticipate how the rest of it will run.
How many ICT weekly profiles are there?
Twelve in the commonly taught set: six families, each in a bullish and a bearish form. The families are the classic Tuesday low or high of the week, the Wednesday low or high of the week, the consolidation Thursday reversal, the consolidation midweek rally or decline, the seek-and-destroy Friday, and the Wednesday weekly reversal. Listings name them with small differences.
What is the classic Tuesday low of the week?
The bullish template in which the week's low forms on Tuesday, often after a Monday that drifts or dips toward a higher-timeframe discount array, and price then rises for the rest of the week. The bearish mirror is the classic Tuesday high of the week.
What is a consolidation Thursday reversal?
A template in which the early part of the week holds inside a range without clear direction, and Thursday takes out one side and reverses, setting the week's extreme against the early drift. It is taught in a bullish and a bearish form.
How are weekly profiles used?
As taught: form a higher-timeframe bias before the week begins, watch how Monday and Tuesday behave around nearby arrays and liquidity, select the template that fits, and look for entries on the days the template says the week's direction will run. Choosing the template before the evidence is in is what makes a profile testable.
What are ICT daily profiles?
The same idea one scale down: templates for when in the day the day's high and low form, relative to the sessions and the kill zones. Weekly and daily profiles are often read together, the week's template setting expectations for each day.
Related terms
Derived from the links this entry makes and the entries that link back to it.