79 / 110
Power of three (PO3)
Written PO3 throughout.
Working definition
ICT's reading of one candle, most often a day, from its opening price: price holds near the open, runs beyond it against the direction the candle will close in, then turns, reaches the opposite extreme and closes toward it. The three phases are named accumulation, manipulation and distribution, or AMD.
Every candle opens somewhere, and power of three reads the whole candle from that price: a spell near the open, a run the wrong way, and the move that carries the close.
The shape, stated
Take one candle on a declared timeframe, most often a day, and its opening price. Power of three divides the candle into three phases by where price trades relative to that open. In accumulation, price holds in a band around the open. In manipulation, it leaves the band against the direction the candle will close in: below the open on a day that closes higher, above it on a day that closes lower. In distribution, it turns, crosses back over the open, runs to the opposite extreme and closes toward it. The initials give the model its other name, AMD.
On a finished daily candle the shape is simple to state. A bullish power of three has its low beneath the open and its close above the open, near the high. A bearish one mirrors it: its high above the open and its close below the open, near the low. Looser tellings draw accumulation as any consolidation before the counter-move, wherever it sits, which leaves its edges to the eye; the open-relative form ties every phase to one price. The detector campaign registers the reading in that form: open-relative geometry, with the phases recorded as time fields.
The elections
The phase names supply no numbers, so a reading has to choose them.
- The open and the end. One guide marks the day’s open at midnight New York time, the anchor the judas swing takes in its strictest telling; other explanations name only the day’s open. Currencies and futures also begin a trading day after the 17:00 New York close, and United States index products open their regular session at 09:30. The end of the candle is chosen with the open.
- The accumulation band. How far from the open price may trade while accumulation lasts: a number of pips, or a fraction of average true range, which compares quiet and busy days more fairly.
- The manipulation depth. How far beyond the band the counter-move must run to count, and whether it must also sweep a pool, such as the low of the Asian range or the previous day’s low.
- The decision time. When the reading is committed, for instance at the end of the London open window. Before that moment the candle is being read; after it, the reading can only be scored.
Each is a parameter someone chose. A count of power-of-three days that states none of them describes a different set of days from one that states all four.
A worked day
Constructed numbers, not a record of any session. EUR/USD is read from the midnight New York open to the 17:00 close, with an accumulation band ten pips either side of the open and a manipulation depth of at least ten pips beyond the band. All three settings are elections.
- Accumulation. The candle opens at 1.0850. Until 02:10 price trades between 1.0843 and 1.0857, inside the band from 1.0840 to 1.0860.
- Manipulation. After the London open price falls to 1.0828 at 03:20, twenty-two pips below the open and twelve beyond the band’s lower edge, and is back above the open by 05:00.
- Distribution. Price rises through the New York morning to a high of 1.0903 at 09:40 and closes at 17:00 at 1.0895.
Four prices give the geometry. The candle closed forty-five pips above its open, so it is bullish. The manipulation excursion, open minus low, is twenty-two pips; the distribution, high minus open, is fifty-three; the range is seventy-five, and the close sits eight pips beneath the high. The time fields put the low at 03:20, inside the London open window of the kill zones, and the high at 09:40, inside the New York open window, which is the order the taught picture expects.
The bearish mirror, again constructed. GBP/USD opens at midnight at 1.2740 and holds between 1.2733 and 1.2748 until 02:30. It rises to 1.2764 at 03:05, twenty-four pips above the open and fourteen beyond the band, falls back through the open by 04:30, prints its low of 1.2681 at 08:50 and closes at 1.2690, fifty pips below the open and nine above the low.
The open decides the reading
Move the open and the same session reads differently. Take the EUR/USD day again and read it from the 17:00 open of the evening before, constructed at 1.0835, with the evening’s low above 1.0828. The 03:20 low is now seven pips below the open, inside a ten-pip band, so under the same elections the candle has no manipulation phase at all, although it closes sixty pips higher. Nothing in the session changed; the open did.
In markets that trade through midnight, such as spot currencies, and in crypto, which trades every day, the open is a clock choice rather than a first trade after a halt, and the reading inherits whatever that choice makes of the day. Each broker’s feed can also print a different price at that minute, so a reading quoted without its instrument, feed and open cannot be found again.
Phases as times
A phase name says what price did; a time field says when. Recording three times per candle, when price first left the band, when the manipulation extreme printed and when the far extreme printed, turns the story into data that can be set against the clock. One common telling assigns the phases to sessions: Asia builds the range, London runs it against the day, and New York delivers the move, the sequence the daily bias entry describes for a bullish day.
The times also show two elections colliding. Under the kill-zone convention this glossary states, the Asian window runs from 20:00 to midnight New York time. A candle opened at midnight begins as that window ends. Read from midnight to the 17:00 close, it leaves the Asian range the session story calls accumulation outside every candle; only a candle that runs from midnight to midnight puts it in the previous one, while a candle opened after the 17:00 close contains it. Session tables that start Asia at midnight put it back inside the midnight candle. Which open is paired with which session table decides where on the chart accumulation sits.
And the times carry a base rate. Hours of the day differ in activity and typical range, so a count of daily lows in the London open window means something only against the hour-of-day seasonality that exists without any story.
Where the names come from
The three names tell a story about large participants: positions built quietly near the open, price pushed the wrong way to collect the orders resting beyond the early range, then those positions released in the direction of the day. Teaching tells the story as description. A chart records prices and times, not whose orders filled or why, so this entry uses the names as labels for where price traded relative to the open and when. The attribution is the one the smart money concepts entry describes as something a chart cannot confirm.
The borrowing from Wyckoff is loose. In Wyckoff’s schematics accumulation and distribution are opposite kinds of trading range spanning many bars, one read before a markup and the other before a markdown. Power of three puts both words inside every candle, bullish or bearish, and uses distribution for the directional leg itself.
How it composes the vocabulary
Most of the model is built from terms this glossary defines on their own pages. The manipulation phase is usually drawn as a liquidity sweep of the Asian range or the previous day’s extreme, and at a session open it is the event the judas swing names.
The turn is confirmed on a lower timeframe by a market structure shift, often delivered with displacement, and the entry is taken on a return into the fair value gap or block the shift left. The direction comes from outside the candle: the bias and the draw on liquidity are set before it opens, and power of three describes only the route the candle is expected to take. What the model adds is the open as the reference price and a fixed order for the phases.
Other candles
Nothing in the reading is specific to a day. On a weekly candle the open is the Sunday open, manipulation is an early-week run against the week’s direction and distribution is the rest of the week, which is why a weekly power-of-three reading and a Tuesday-low weekly profile can describe the same week. Teaching applies the same phases on other timeframes too. One guide calls power of three the daily form of the logic behind the market maker model, which maps a multi-leg campaign across many candles. The scales are different objects: a campaign drawn on hourly candles can sit inside a single daily candle, and a result for one timeframe does not transfer to another.
Identifying one, step by step
- Set the chart to New York time and state the candle: its timeframe, its open and its end.
- Write the bias before the open, with the level that would score it wrong, if the reading is to be tested rather than illustrated.
- Draw the accumulation band at the stated distance either side of the open.
- Mark the first exit from the band: its time, its side, how far it ran, and whether it swept a pool.
- Commit the reading at the decision time: a counter-move of the stated depth against the bias, or none.
- Score it at the close: the side of the open the candle closed on, and the times of its high and low.
Trading it, as taught
Teaching aims to enter as manipulation ends and to hold through distribution. A bias is set before the session from the daily or four-hour chart, and the day’s open is marked. With a bullish bias, the trader waits for price to trade below the open, often through the Asian low or the previous day’s low, then looks on a five- or fifteen-minute chart for a structure shift back upward.
The entry comes on that shift or on a return into the gap it left, the stop sits beyond the manipulation low, and the target is liquidity on the far side of the day, such as the previous day’s high. One guide sets the target at a fixed multiple of the stop distance instead. Each of these is an election, and a result for one set of them does not transfer to another.
What it is not
The three in the name counts phases of one candle, not pushes, touches or candles. The reading is not a signal on its own, because its direction comes from a bias set elsewhere. It is not a record of who traded, because the phase names are labels. And it is not a Wyckoff schematic, whose ranges span many bars.
Common mistakes
Marking the open from a broker’s server clock, which moves it to a different price. Switching between the midnight and 17:00 opens from one day to the next. Naming the phases after the close, when almost any candle that traded on both sides of its open can be made to fit. Calling the first move away from the open manipulation because the bias says so, when a day that never crosses back has simply gone the other way. And counting the days that followed the picture while forgetting the days that ran against the bias and kept going.
What the shape does not settle
The geometry is exact: an open, a high, a low, a close and the times of the two extremes, which two people with the same feed and the same open will compute identically. The claim is about sequence. Every candle that trades on both sides of its open and closes away from it already has a counter-move and a far extreme, so finished examples are bound to be plentiful.
The testable form commits at the decision time: among days with a bias written before the open and a counter-move of the stated depth by then, how often does the candle close beyond the open in the bias direction, compared with days whose bias came from a simple baseline such as the previous day’s direction, and with the hours at which daily extremes form anyway. The power-of-three driver has a row in the claims ledger, where that verdict renders. The liquidity pools indicator datasheet draws the midnight, 08:30 and 09:30 New York opens as levels with above-and-below state, and the two lenses keep the drawing, which anyone can make, apart from the claim about how the day unfolds.
Where it sits in the ICT sequence
The ICT vocabulary in the order the method is taught, with a step for each kind of object.
- Step
- 08 of 08 Models: the steps composed into named setups
- Also at this step
- ICT 2022 model, ICT unicorn model, Smart money reversal (SMR), Market maker model (MMXM), One shot one kill (OSOK)
- Before it
- Optimal trade entry (OTE)
- After it
- ICT 2022 model
The shape, drawn
The smallest arrangement the definition admits. It is a drawing of a rule, not a reading of a market — nothing here is measured, and the table below it is the authoritative version.
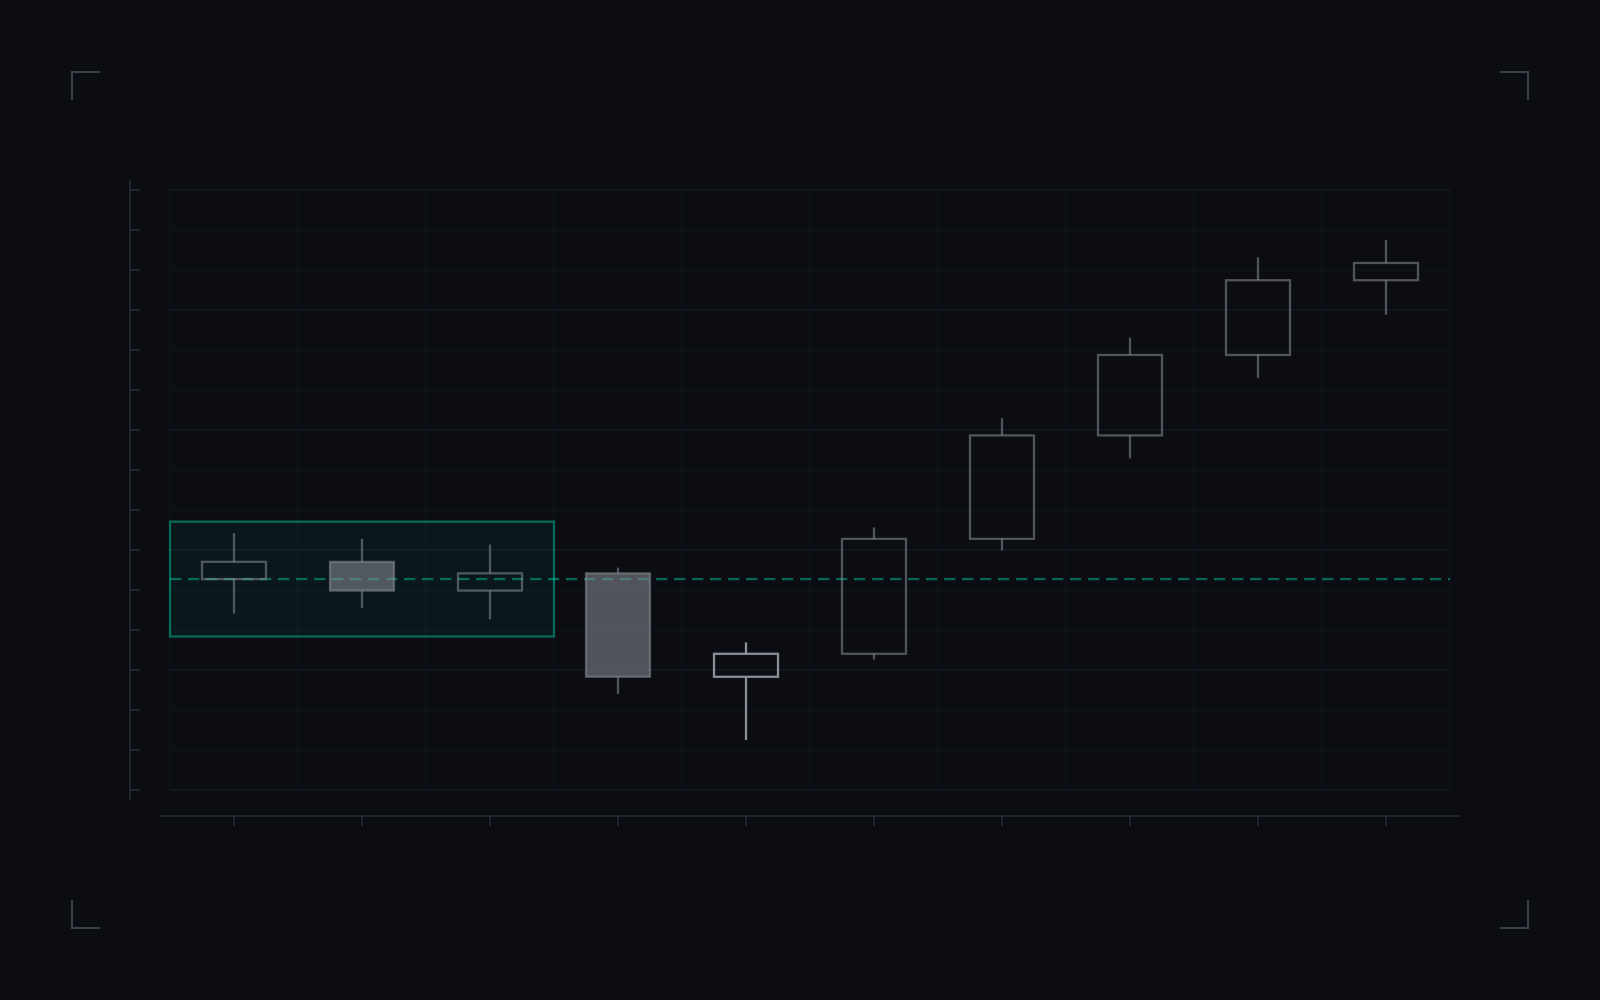
- The declared open. Every phase is read against this one price.
- The accumulation band: a stated distance either side of the open, where price holds first.
- Falling candles. Inside the band they belong to accumulation; beneath it, the run against the close is manipulation.
- The manipulation extreme: the candle that prints the day’s low beneath the band, then closes higher.
- Rising candles. Once price crosses back over the open, the run to the far extreme and the close is distribution.
A bullish power of three on one day’s intraday candles: price holds inside a band around the declared open, runs beneath the band against the direction the day closes in, then crosses back over the open and closes near the far extreme.
The drawing establishes the open-relative shape of a finished candle. It does not establish that a run against a bias written before the open is followed by a close beyond the open in the bias direction.
Power of three (PO3): what the definition states, in full.
| Element | What the definition states |
|---|---|
| Reference price | The declared open of one candle, with its end chosen with it. |
| Accumulation | Price inside a band around the open. |
| Manipulation | A run beyond the band against the direction the candle closes in. |
| Distribution | The cross back over the open, the far extreme and the close toward it. |
| Band and depthHow wide the band is and how far beyond it the run must go are parameters, in pips or in fractions of average true range. | election pending |
| Decision timeA reading committed after the close fits almost any candle that traded on both sides of its open. | election pending |
| Not established | Whether a run against a bias stated in advance is followed by a close beyond the open in the bias direction. |
Commonly confused with
Neighbouring concepts that get used interchangeably, and the distinction that actually separates them.
- Judas swing
The judas swing is one event with parameters: the first push after a declared open that sweeps a pool, closes back inside and gives way to a structure shift the other way. Power of three reads the whole candle around its open, and the judas swing is the event its manipulation phase usually points at. Read from the open alone, a candle can show the power-of-three shape with no pool swept.
- Market maker model
The market maker model maps a campaign across many candles: legs away from a consolidation, a reversal at a higher-timeframe array and a return through the same pauses. Power of three is the shape of one candle around its open. One guide calls it the daily form of the same logic; the two differ in scale, and a test of one is not a test of the other.
- Weekly profiles
A weekly profile names the day on which the week's high or low is expected to form. Power of three read on a weekly candle describes the week by its open, its early run against the week's direction, its far extreme and its close. A Tuesday-low profile and a bullish weekly power-of-three reading can describe the same week from two angles.
- Wyckoff accumulation and distribution
In Wyckoff's schematics accumulation and distribution are opposite kinds of trading range across many bars, one read before a markup and the other before a markdown. Power of three uses both words inside every candle, bullish or bearish, and its distribution is the directional leg itself, not a range at a top.
- Liquidity sweep
A sweep needs a qualifying prior extreme, a trade through it and a close back inside. The manipulation phase, read from the open, needs only a run beyond the open against the candle's close. Teaching usually places a sweep of the Asian range or the previous day's extreme inside that run, and requiring one narrows the days that qualify.
How to measure it in your own data
A definition you cannot test is a definition you have to take on trust. This is the shortest honest route from the concept to a number you computed yourself.
- Records you need
Intraday candles on a clock converted to New York time, fine enough to time each extreme; the declared open and end of each candle, such as the midnight open and the 17:00 close; the band, depth and decision-time elections; and, for the predictive form, a bias written down before each open.
- What you compute
For each candle, record the open, high, low and close, the times of the high and the low, and the time price first left the band around the open. The excursion from the open against the close is the manipulation excursion, and the excursion with it is the distribution. Then flag candles that, by the decision time, ran beyond the band by the stated depth against a bias stated in advance, and count how often they closed beyond the open in the bias direction, beside the same count for a baseline bias.
- What the answer tells you
A daily candle with a wick beyond its open on one side, a long body the other way and a close near the far extreme. Every candle that trades on both sides of its open and closes away from it already has the first two parts of that picture, so the shape found afterwards shows little; the reading that counts is the one committed at the decision time.
Questions and answers
What is power of three (PO3) in trading?
ICT's reading of one candle, usually a day, around its opening price. Price first holds near the open, then runs beyond it against the direction the candle will close in, then turns, reaches the opposite extreme and closes toward it. Teaching names the three phases accumulation, manipulation and distribution.
What does AMD stand for in ICT?
Accumulation, manipulation and distribution, the three phases of power of three. The names tell a story about large participants building, disguising and releasing positions, which a chart cannot confirm. What a chart records is where price traded relative to the open in each phase, and when.
Which open does power of three use?
The one declared, because explanations differ. One guide marks the day's open at midnight New York time and others name only the day's open; currencies and futures also begin a trading day after the 17:00 New York close, and United States index products open at 09:30. The same day can show a manipulation phase from one open and none from another.
How is power of three traded?
As taught: set a bias from the daily or four-hour chart before the session, mark the day's open, and wait for price to run beyond the open against the bias, often through the Asian range or the previous day's extreme. A lower-timeframe structure shift back toward the bias is the trigger, the stop sits beyond the manipulation extreme, and the target is liquidity on the far side of the day. That describes the practice, not its results.
Does power of three work?
No drawing can say. Any candle that trades on both sides of its open and closes away from it can be drawn as power of three once it has closed. The testable form writes the bias before the open, commits the reading at a stated time, and counts how often those days close beyond the open in the bias direction, against a baseline such as the previous day's direction.
Related terms
Derived from the links this entry makes and the entries that link back to it.