Liquidity Pools Indicator
The standing pool map — old highs and lows, equal extremes, session marks — one registry.
Every claim in the sweep-and-run vocabulary presupposes a map of where the resting orders should be, and this instrument is that map — one registry, one set of rules, no repainting.
What it draws
The pool candidates the taxonomy reasons about, from one registry: swing extremes under the stated fractal rule; equal-highs and equal-lows clusters within the stated tolerance, marked as the denser pools they are taught to be; and prior-day, prior-week, prior-month and session extremes with their scopes labelled. Beside them sit the anchor opens — midnight New York, the morning opens, weekly and monthly — drawn as reference levels carrying above/below state.
Swept pools grey out and remain, because a map that deletes its history flatters every story told over it, and half the value of a pool map is being able to see, a week later, which levels were taken and which were left alone. Every mark carries its scope and its rule, so the map reads the same to anyone running the same configuration.
One registry, shared rules
The sweep instrument in this line reads this same registry — same swing rule, same tolerance — which is what lets a sweep flag name the exact pool it consumed.
Fragmented tools each keeping private lists is how the vocabulary’s claims became unfalsifiable; a shared registry with printed rules is the repair. What the registry does not claim is that orders actually rest where it points. It marks conventional candidates — the levels where stops and entries are habitually parked — and the habit is the plausible core, not a measurement of anyone’s book. Whether marked pools behave differently from unmarked prices, and whether side-of-open states condition anything beyond the prior close’s free alternative, are the calibration layer’s questions, answered there against stated nulls or not at all. The map is a hypothesis about where the orders are. It is drawn precisely so the hypothesis can lose.
The object it looks for
The frozen definition, drawn. This is the geometry the detector is built to find — not a capture of the instrument running, and not a result. A drawing that implied otherwise would be the one thing this line exists to refuse.
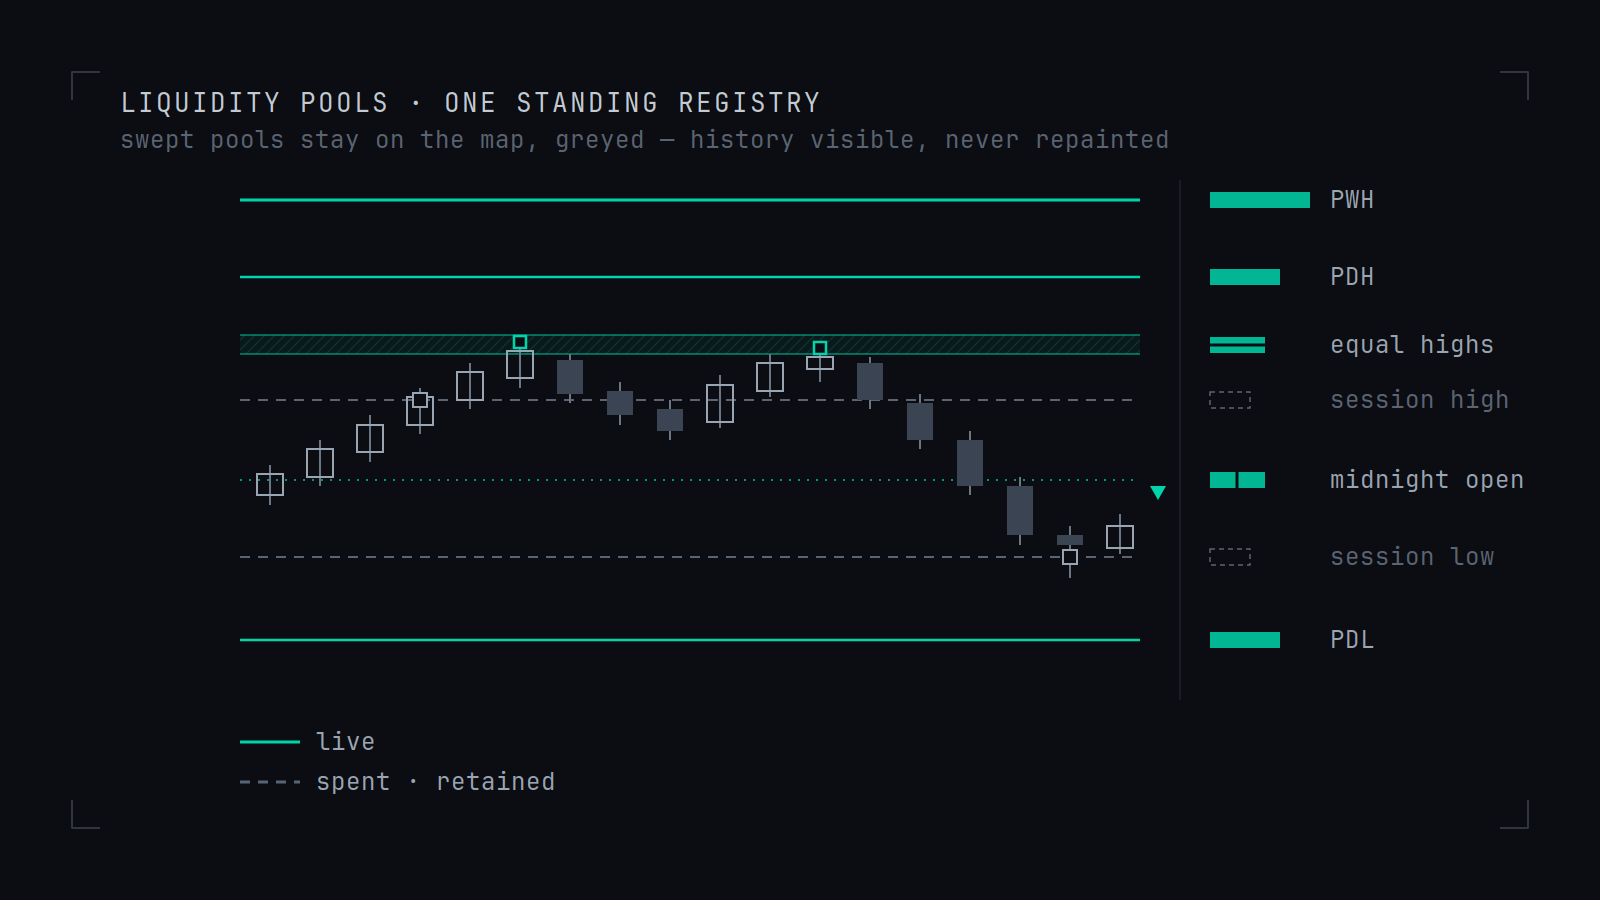
One standing registry. Every pool the definition admits is drawn once and kept — and a pool that has been taken greys out rather than disappearing, so the map shows what was there as well as what is.
Registering a pool establishes that the level existed and when it was taken. It does not establish that price returns to one, or that taking one means anything.
Liquidity Pools Indicator: what the frozen definition states, in full.
| Element | What the definition states |
|---|---|
| Members | Swing highs and lows, previous month, week and day extremes, equal highs and lows, and session extremes. |
| Anchor opens | The midnight, 08:30, 09:30, weekly and monthly opens, drawn beside the pools as reference levels with above/below state. |
| Equality toleranceHow near two extremes must sit to register as one pool is a parameter, not a fact about the market. | election pending |
| Spent poolsA level that has been taken is still a fact about the tape; deleting it would edit the past. | Retained and greyed, never removed. |
| Repainting | None. A pool’s STATE changes when it is taken; its history does not. |
| Not established | Whether price returns to a pool, how often, or what a return is worth. |
The definition in full, with the terms it uses, is at the glossary entry.
The parameters, in the open
Every threshold is a named parameter with its shipped state visible. Where a default reads election pending, the calibration run has not yet frozen it, and this page says so instead of inventing a number. Presets populate editable fields; they never lock them.
Liquidity Pools Indicator: every threshold it exposes, and the state each one is in.
| Parameter | Shipped state | What it decides |
|---|---|---|
| Swing rule | k=1 (3-bar fractal); k=2 exposed | Which extremes qualify for the registry at all. |
| Equality tolerance | election pending | The measured-spread-units band inside which highs or lows count as equal — the most visible pools. |
| Timeframe marks | PDH/PDL · PWH/PWL · monthly · session | Prior-day, prior-week, prior-month and session extremes, each labelled with its scope. |
| Anchor opens | midnight NY · 08:30 · 09:30 · weekly · monthly | The taxonomy's reference opens, drawn as levels with above/below state. |
| Consumed-pool handling | greyed, retained | A swept pool stays on the map, marked spent — history visible rather than repainted away. |
The calibration certificate
Every instrument in this line ships with its report: the reaction and state statistics for its objects, computed on this estate's own recorded data under the campaign's measurement design, with the vintage's hash and date printed — and a refusal state when the vintage ages past its declared cadence. The report ships whatever it says.
This instrument's certificateNOT YET COMPUTED
The campaign's entry bar is the reason: no driver takes a live reading before it recovers a planted effect through the measurement harness, and the harness comes before every certificate. The drafting instrument is in build for the platforms above. Nothing is purchasable yet, here or anywhere.
What this instrument does not do
It makes no claim that its objects predict anything, and it ships no signals. It draws defined geometry under stated parameters; whether that geometry carries information is the measurement layer's question, answered against stated nulls and published either way. No performance figures appear on this page because none have been computed — and when they are, they arrive as the certificate above, not as marketing.
The research on the claim it draws
The objects drawn by the Liquidity Pools Indicator are taught with a claim, and two research notes on this site examine that claim; none tests the indicator itself.
Questions and answers
What does the Liquidity Pools Indicator mark as buy-side and sell-side liquidity?
The conventional resting-order candidates, from one registry: swing highs and lows under the fractal rule, equal highs and equal lows within a stated tolerance, and prior-day, prior-week, prior-month and session extremes. Pools above price are the buy-side candidates and pools below it the sell-side. Beside them it draws the anchor opens at midnight, 08:30 and 09:30 New York time with the weekly and monthly opens, as reference levels with above/below state, and every mark carries its scope and its rule.
What counts as equal highs or equal lows?
Two or more extremes within the equality tolerance of each other, measured in spread units rather than judged by eye, and marked as the denser pools they are taught to be. The tolerance's shipped default is the calibration run's to freeze.
What happens to a pool after price sweeps it?
It greys out and stays on the map, marked spent. A map that deletes its history flatters every story told over it, and much of the value of a pool map is being able to see, a week later, which levels were taken and which were left alone.
Do orders actually rest at these levels?
The registry does not claim they do. It marks the levels where stops and entries are habitually parked, and treats that habit as a hypothesis drawn precisely enough to lose. On whether a level remembers its own history, the research note titled The level that remembered nothing found, across sixteen years and 183,689 revisits, that the apparent memory was recency: what happened at a level most recently predicts its next behaviour, and the more distant past adds nothing measurable once that is held fixed.
Where this sits
This instrument's concepts are defined in the glossary: buy side and sell side liquidity · liquidity sweep · inducement · order block. Its drivers sit in the claims ledger (W1.12, W1.14) with their verdicts rendered honestly until computed.
Also in this line: Fair Value Gap Indicator · Order Block Indicator · Liquidity Sweep Indicator · Market Structure Indicator · Displacement Indicator · Session & Killzone Clock · Premium-Discount & OTE Indicator · Opening Gap Indicator · Judas & Silver Bullet Models · SMT Divergence Indicator · Candle Range Theory Indicator.
Standing policy
- No promise of profit, ever. Hadal makes no performance claims and carries no implied edge. Past measurements describe instrument behaviour — never future returns.
- You own risk management. Hadal cannot control it and does not insure it. Good tools do not fix bad discipline — and this site says so.
- Analytical tools, for discretionary use. Nothing here is investment advice or a recommendation to trade. Every decision, and every outcome, is yours.
The same statement stands in the footer of every page.Terms Privacy