Opening Gap Indicator
NDOG and NWOG drawn from the census of real halts — sized, tracked, and honestly scoped.
Opening-gap vocabulary imported from exchange markets breaks quietly in FX, where most days have no halt at all. This instrument starts from that fact instead of tripping over it.
What it draws
New-week opening gaps — Friday close to Sunday open, the one structural halt an over-the-counter currency market actually has — with ATR-scaled size, midpoint line, and the full touch-and-fill state machine, retaining the campaign’s stated default of the last five.
New-day gaps are drawn only where the per-instrument census finds a genuine daily pause: some brokers halt around the daily rollover, many do not, and a gap indicator that assumes a halt invents objects on charts that never gapped. The census result is displayed, so what the instrument will and will not draw on this feed is a stated fact rather than a surprise, and the same instrument moved to a different broker re-runs the census rather than carrying the old answer along.
The census is the honesty mechanism
Whether a halt exists is measurable per instrument per feed, and this indicator measures it before drawing anything — the campaign’s own gap-census discipline, shipped.
Where the census says no halt, the honest render is nothing, and nothing is what renders. The same restraint governs the claims: whether opening gaps close, at what rates, over what horizons, sized how — those are the time-to-fill distributions the calibration layer computes against geometric nulls, and nothing about a drawn gap entitles anyone to the word “always”. Gap objects also stay firmly separated from the imbalance family — the three-candle gaps of continuous trading are a different object with a different page — because keeping the two apart is half the value of drawing either precisely. The instrument renders what opened; what closes is the data’s to say, and the ledger rows its drivers feed will say it with a number or not at all.
The object it looks for
The frozen definition, drawn. This is the geometry the detector is built to find — not a capture of the instrument running, and not a result. A drawing that implied otherwise would be the one thing this line exists to refuse.
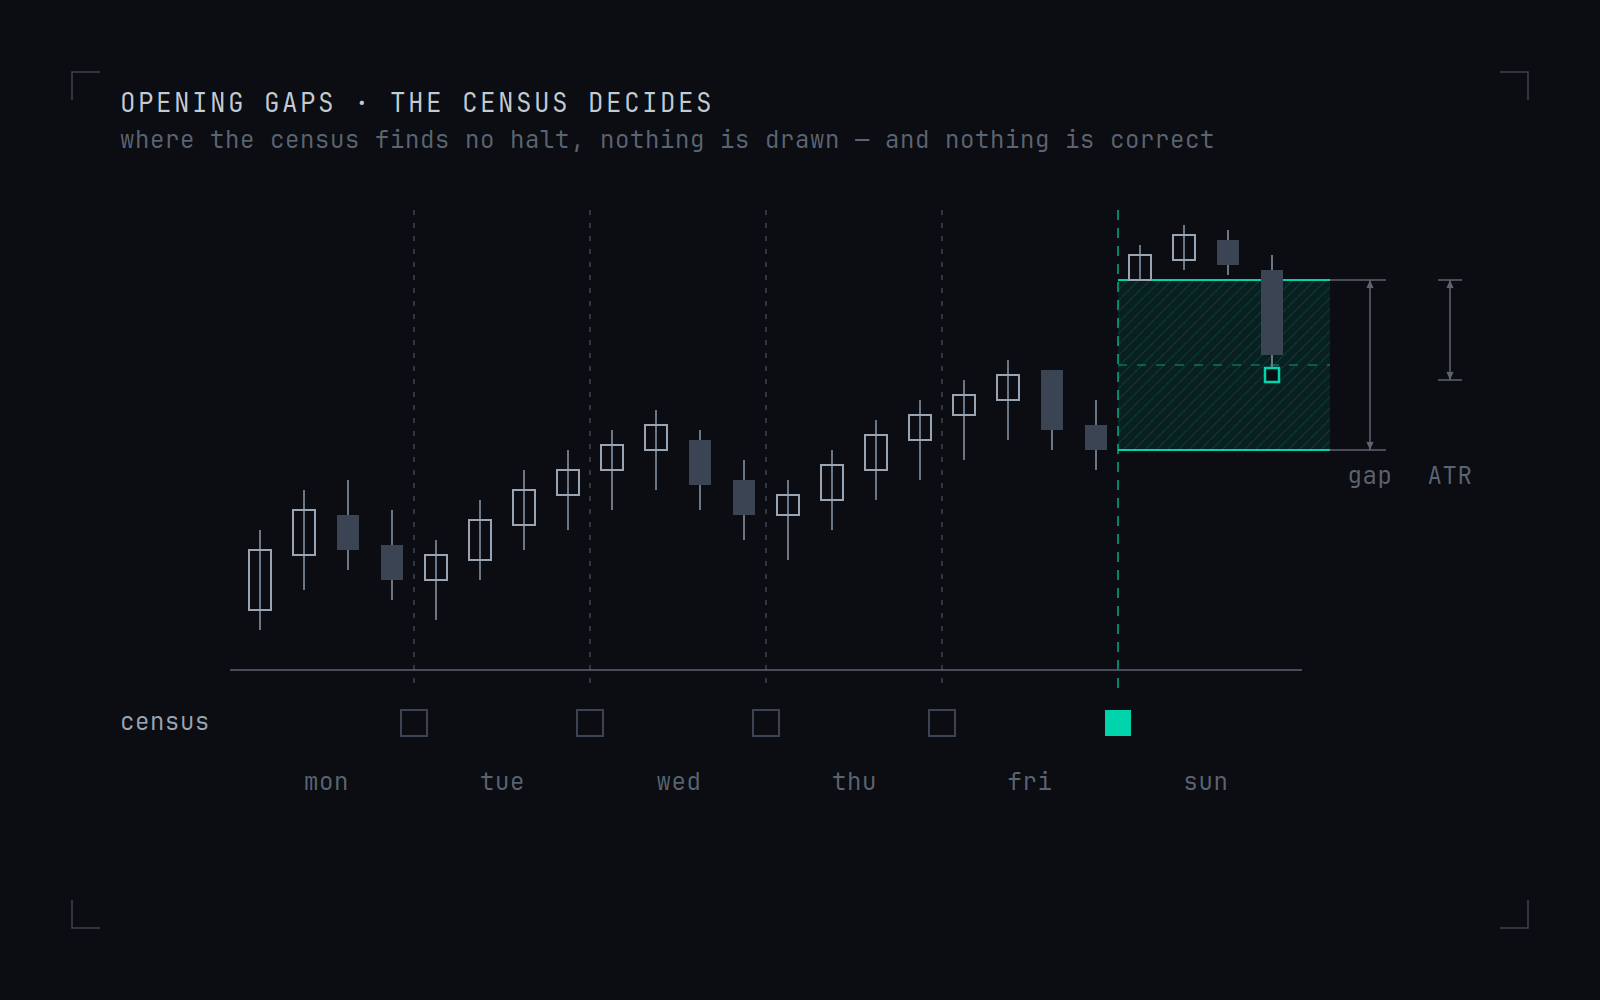
The census decides. Five session boundaries and one halt: the weekend gap is drawn because the census found a halt there, and the four daily boundaries are left empty because it did not — which is the answer, not a gap in the answer.
Drawing a gap establishes that a halt existed and how large the gap was against the instrument’s own volatility. It does not establish that the gap fills, or that a fill is worth anything.
Opening Gap Indicator: what the frozen definition states, in full.
| Element | What the definition states |
|---|---|
| Gap censusMost spot FX has no daily halt to gap across. Where the census finds none, nothing is drawn, and nothing is the correct result rather than a missing one. | Measured per instrument, never assumed. |
| New-day gap | Daily halt close to open, where the census finds a halt. |
| New-week gap | Friday close to Sunday open. |
| Retention windowA stated window, so the map does not silently grow into a wall of every gap ever printed. | The last five weekly gaps. |
| Size scalingA gap measured in price says nothing until it is expressed against the instrument’s own volatility. | ATR-scaled. |
| Not established | Whether an opening gap fills, how often, or what a fill is worth. |
The definition in full, with the terms it uses, is at the glossary entry.
The parameters, in the open
Every threshold is a named parameter with its shipped state visible. Where a default reads election pending, the calibration run has not yet frozen it, and this page says so instead of inventing a number. Presets populate editable fields; they never lock them.
Opening Gap Indicator: every threshold it exposes, and the state each one is in.
| Parameter | Shipped state | What it decides |
|---|---|---|
| Gap census | measured per instrument, never assumed | Which halts actually exist in this instrument's calendar — weekend gaps are structural in OTC FX; any daily pause is broker-dependent and verified before a gap is drawn. |
| New-day gap (NDOG) | daily halt close→open, per census | The taxonomy's daily opening gap, drawn only where the census says a daily halt exists. |
| New-week gap (NWOG) | Friday close → Sunday open | The weekend gap, with the retention window below governing how many stay on the chart. |
| Retention window | last 5 | The campaign's stated default for how many prior weekly gaps remain rendered. |
| Size scaling | ATR-scaled | Gap sizes expressed against recent volatility, with midpoint lines and touch/fill states tracked. |
The calibration certificate
Every instrument in this line ships with its report: the reaction and state statistics for its objects, computed on this estate's own recorded data under the campaign's measurement design, with the vintage's hash and date printed — and a refusal state when the vintage ages past its declared cadence. The report ships whatever it says.
This instrument's certificateNOT YET COMPUTED
The campaign's entry bar is the reason: no driver takes a live reading before it recovers a planted effect through the measurement harness, and the harness comes before every certificate. The drafting instrument is in build for the platforms above. Nothing is purchasable yet, here or anywhere.
What this instrument does not do
It makes no claim that its objects predict anything, and it ships no signals. It draws defined geometry under stated parameters; whether that geometry carries information is the measurement layer's question, answered against stated nulls and published either way. No performance figures appear on this page because none have been computed — and when they are, they arrive as the certificate above, not as marketing.
The research on the claim it draws
The objects drawn by the Opening Gap Indicator are taught with a claim, and no research note on this site examines that claim.
Questions and answers
Why does the Opening Gap Indicator sometimes draw no new day opening gap?
Because the feed has no daily halt to gap across. An over-the-counter currency market has one structural halt, the weekend, which is why the new week opening gap runs from Friday close to Sunday open. A pause around the daily rollover depends on the broker, so a census of the instrument's calendar checks for a genuine halt first, and where it finds none, no new day gap renders.
How many weekly opening gaps stay on the chart?
The last five weekly gaps by default, each with its size scaled to recent volatility, its midpoint line and its touch-and-fill state. Daily gaps follow the census for the instrument and feed in use, and moving the indicator to a different broker re-runs the census instead of carrying the old answer across.
Does the indicator say whether an opening gap will close?
No. Whether opening gaps close, how often, over what horizons and at what sizes are time-to-fill distributions for the calibration layer to compute against geometric nulls. Nothing about a drawn gap entitles anyone to the word always, and the ledger rows its drivers feed will report a number or nothing.
Why are opening gaps kept apart from fair value gaps?
Because they are different objects. An opening gap spans a halt, from the last price before it to the first price after it; a fair value gap is a three-candle imbalance printed during continuous trading, and it has its own instrument and its own page. Keeping the two apart is half the value of drawing either precisely.
Where this sits
This instrument's concepts are defined in the glossary: new week opening gap · new day opening gap · fair value gap · ict kill zones. Its drivers sit in the claims ledger (W1.1, W1.2, W1.3, W1.4) with their verdicts rendered honestly until computed.
Also in this line: Fair Value Gap Indicator · Order Block Indicator · Liquidity Sweep Indicator · Market Structure Indicator · Displacement Indicator · Session & Killzone Clock · Liquidity Pools Indicator · Premium-Discount & OTE Indicator · Judas & Silver Bullet Models · SMT Divergence Indicator · Candle Range Theory Indicator.
Standing policy
- No promise of profit, ever. Hadal makes no performance claims and carries no implied edge. Past measurements describe instrument behaviour — never future returns.
- You own risk management. Hadal cannot control it and does not insure it. Good tools do not fix bad discipline — and this site says so.
- Analytical tools, for discretionary use. Nothing here is investment advice or a recommendation to trade. Every decision, and every outcome, is yours.
The same statement stands in the footer of every page.Terms Privacy