Market Structure Indicator
BOS, CHoCH and MSS from one swing engine — the full hierarchy, every election printed.
Structure vocabulary lives or dies on the swing rule, and most structure tools never tell you theirs. This one runs a single fractal engine, prints its elections, and labels every event with the tier that produced it.
What it draws
The swing hierarchy itself — short-term points, and the intermediate and long-term points they compose into — plus the three events the vocabulary defines over it: breaks of structure with the trend, changes of character against it, and market structure shifts where the counter-break takes a qualifying tier, with the optional displacement qualifier applied at the campaign’s stated per-bar default. Each label carries its tier and its rule, so a shift on this chart means one checkable thing rather than six arguable ones. The optional change-in-state-of-delivery flags render alongside for comparison when enabled, timed off the same bars, so the two competing shift vocabularies can be watched disagreeing on live charts instead of argued about in the abstract.
One engine, not three
Break of structure, change of character and shift are one geometric test, read by direction and tier, and tools that implement them separately drift apart at exactly the moments that matter.
Here all three read the same swing table — the campaign’s own architecture, where a single swing engine feeds every structure consumer — so the labels cannot disagree with each other about what a swing is, and an election changed in one place changes every event consistently. What the shared engine cannot do is make broken structure continue, or make shifts precede reversals. Those are the distribution claims the vocabulary is built to imply and has never measured; the measurement layer of this line exists to test them against their stated nulls, and its results ship as results — not as defaults quietly tuned to flatter the story. The instrument grades events. The events’ meaning is evidence’s to assign, and until the readings land the grades are grammar, not prophecy.
The object it looks for
The frozen definition, drawn. This is the geometry the detector is built to find — not a capture of the instrument running, and not a result. A drawing that implied otherwise would be the one thing this line exists to refuse.
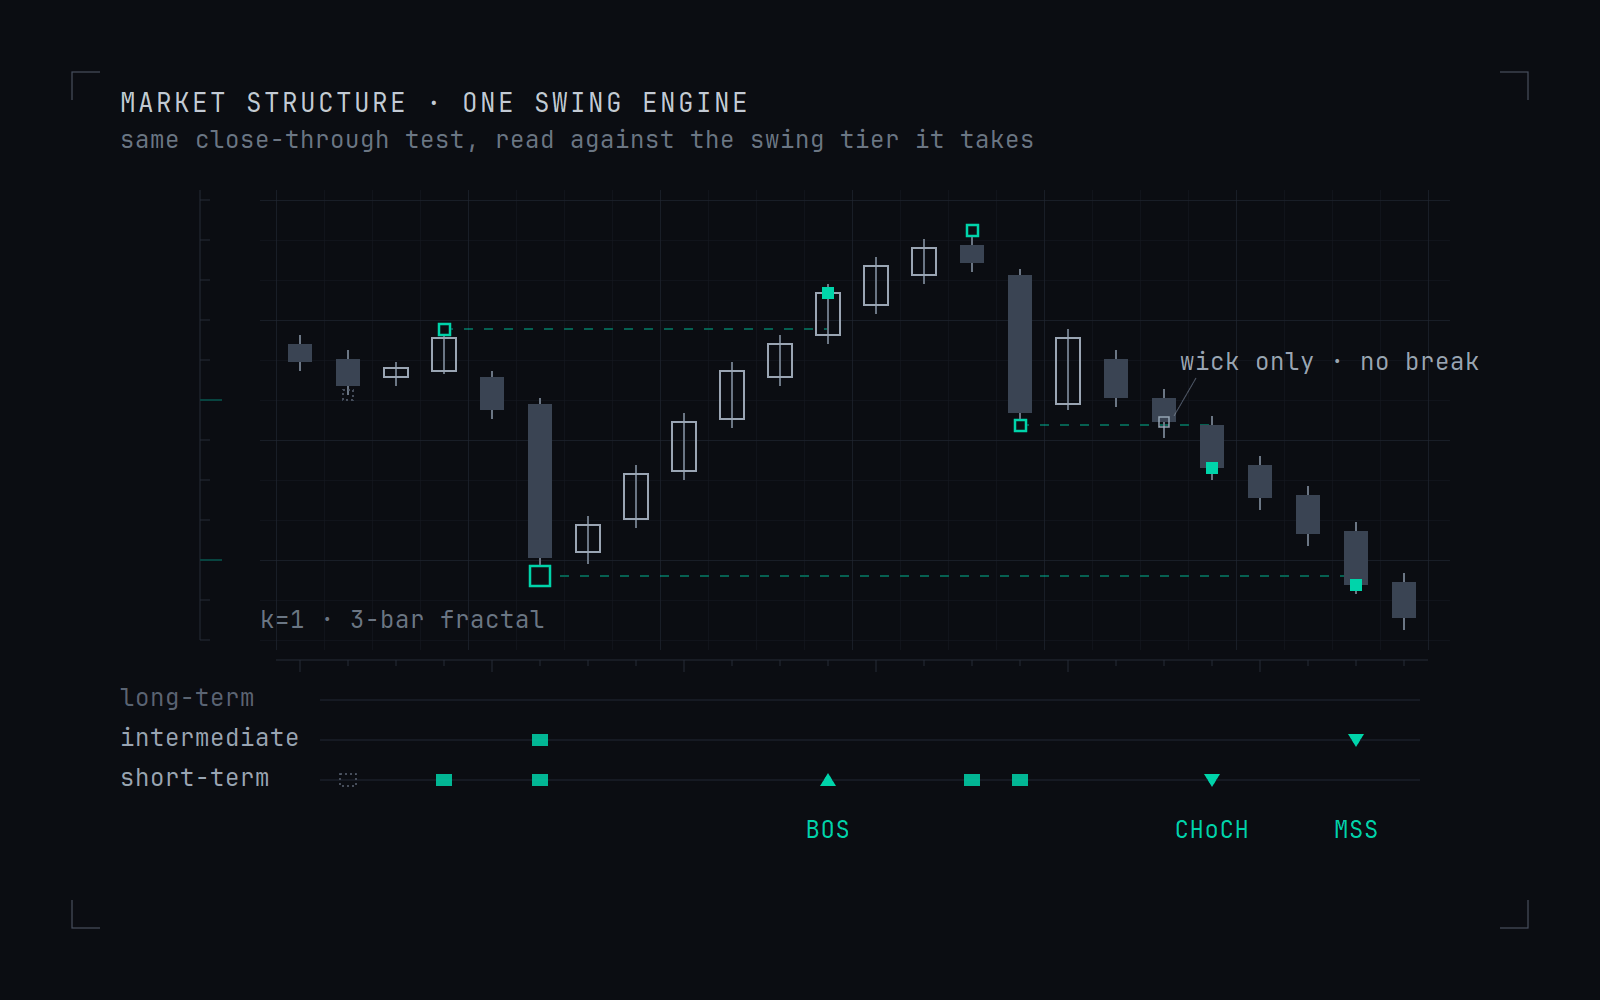
One swing engine, three events. BOS, CHoCH and MSS are the same close-through test read against the tier of the point it takes. The dimmed marker is a consumed swing, retained because it composes the intermediate tier. Illustrative — synthetic series, not recorded data.
Locating an event establishes which point the test consumed and at what tier. It does not establish that a break is followed by anything, or that a tier carries the significance the taxonomy reads into it.
Market Structure Indicator: what the frozen definition states, in full.
| Element | What the definition states |
|---|---|
| Swing rule | A three-bar fractal at k=1: a low flanked by higher lows on either side, and the mirror for highs. |
| Tier | A point is intermediate when flanked by higher lows, or lower highs, of the tier below. The scale continues upward; on this series the long-term row is empty, and is drawn empty. |
| BOS | A close through a swing point in the direction of the trend. |
| CHoCH | The same close-through, against the trend. |
| MSSOne engine, not three: only the tier and the direction change. | The same counter-trend close-through, at an intermediate or higher tier. |
| Break testA bar that pierces the level on its wick and closes back inside does not break it. The drawing shows the two disagreeing, because they routinely do. | Close, not wick. |
| Displacement qualifierNot drawn here. A figure implying it were on would misstate the shipped default. | Off by default |
| Not established | Whether a break of any tier is followed by anything. |
The definition in full, with the terms it uses, is at the glossary entry.
The parameters, in the open
Every threshold is a named parameter with its shipped state visible. Where a default reads election pending, the calibration run has not yet frozen it, and this page says so instead of inventing a number. Presets populate editable fields; they never lock them.
Market Structure Indicator: every threshold it exposes, and the state each one is in.
| Parameter | Shipped state | What it decides |
|---|---|---|
| Swing rule | k=1 (3-bar fractal); k=2 exposed | The flank count that decides which extremes qualify — and, composed, builds the short, intermediate and long-term tiers. |
| Break rule | close-through | Close versus wick as the test for taking a swing out; the two disagree on real charts routinely. |
| Shift tier | intermediate | The minimum swing tier a counter-trend break must take before it labels as a market structure shift. |
| Displacement qualifier | off; body/range ≥ 0.60 when on | Whether a shift additionally requires the breaking move to displace, at the campaign's stated per-bar default. |
| CISD flags | off | The close-through-prior-delivery variant, rendered alongside for comparison when enabled. |
The calibration certificate
Every instrument in this line ships with its report: the reaction and state statistics for its objects, computed on this estate's own recorded data under the campaign's measurement design, with the vintage's hash and date printed — and a refusal state when the vintage ages past its declared cadence. The report ships whatever it says.
This instrument's certificateNOT YET COMPUTED
The campaign's entry bar is the reason: no driver takes a live reading before it recovers a planted effect through the measurement harness, and the harness comes before every certificate. The drafting instrument is in build for the platforms above. Nothing is purchasable yet, here or anywhere.
What this instrument does not do
It makes no claim that its objects predict anything, and it ships no signals. It draws defined geometry under stated parameters; whether that geometry carries information is the measurement layer's question, answered against stated nulls and published either way. No performance figures appear on this page because none have been computed — and when they are, they arrive as the certificate above, not as marketing.
The research on the claim it draws
The objects drawn by the Market Structure Indicator are taught with a claim, and no research note on this site examines that claim.
Questions and answers
How does the Market Structure Indicator tell a break of structure from a change of character?
By direction, on one swing table. A break of structure takes out a swing with the trend and a change of character takes one out against it; a market structure shift is a counter-trend break that takes a swing of at least the stated tier, intermediate by default. All three events read the same swings, so the labels cannot disagree with each other about what a swing is.
Does a wick through a swing count as a break?
Not by default. The break rule ships as close-through, and because a wick test and a close test disagree on real charts routinely, the rule in force is printed. A displacement qualifier, off by default, can additionally require a shift's breaking move to displace, at the per-bar default of a body of at least 60% of the range, and change-in-state-of-delivery flags can be switched on to render alongside for comparison.
What are the swing tiers on the chart?
Short-term swing points come from the fractal rule, one flanking bar on each side by default and two when set, and they compose into intermediate and long-term points. Every structure label carries the tier and the rule that produced it, which is what makes a shift on this chart one checkable event rather than several arguable ones.
Does a labelled break of structure mean the trend will continue?
The indicator makes no such claim. One shared engine cannot make broken structure continue or make shifts precede reversals: those are the distribution claims the vocabulary implies, and this line's measurement layer exists to test them against stated nulls and to report the results as results, not as defaults tuned to flatter the story. Until those readings land, the grades are grammar, not prophecy.
Where this sits
This instrument's concepts are defined in the glossary: break of structure · change of character · market structure shift · displacement. Its drivers sit in the claims ledger (W1.10, W1.11) with their verdicts rendered honestly until computed.
Also in this line: Fair Value Gap Indicator · Order Block Indicator · Liquidity Sweep Indicator · Displacement Indicator · Session & Killzone Clock · Liquidity Pools Indicator · Premium-Discount & OTE Indicator · Opening Gap Indicator · Judas & Silver Bullet Models · SMT Divergence Indicator · Candle Range Theory Indicator.
Standing policy
- No promise of profit, ever. Hadal makes no performance claims and carries no implied edge. Past measurements describe instrument behaviour — never future returns.
- You own risk management. Hadal cannot control it and does not insure it. Good tools do not fix bad discipline — and this site says so.
- Analytical tools, for discretionary use. Nothing here is investment advice or a recommendation to trade. Every decision, and every outcome, is yours.
The same statement stands in the footer of every page.Terms Privacy