96 / 97
Volume profile
Working definition
A histogram of traded volume by price level over a chosen window — where the trading happened on the price axis, rather than when it happened on the time axis.
A chart answers when; a volume profile answers where — and the difference is the entire tool.
The construction is stated in one sentence: over a declared window, bucket traded volume by price at a declared increment, and draw the histogram sideways against the price axis. Everything else is naming. The modal price — the level that did the most business — is the point of control. The tightest band holding a conventional share of the window’s volume, seventy percent in most tools, is the value area. High-volume nodes are prices where trade concentrated; low-volume nodes are prices the market crossed without stopping to transact, the profile’s cousin of a liquidity void. Window, increment and share are elections, and a profile quoted without them is a picture rather than a measurement.
The FX honesty comes first here, because it changes what the tool is. Volume profiling was born on centralised futures exchanges, where the tape is the market. Spot FX has no consolidated tape: every tick stream is one broker’s book or one aggregator’s slice, so an FX profile is a faithful record of a partial market — real, useful, and a statement about a feed. Two feeds draw different profiles of the same hour and neither is lying; which book produced the shape is part of the shape, which is the same provenance discipline this site applies to tick data everywhere.
The neighbouring tools divide the labour. Market profile builds a similar-looking histogram from time rather than volume; the footprint chart keeps the per-bar, per-price, per-side detail the profile aggregates away; and the order book shows resting size where the profile shows transacted history — a high-volume node is a record of past business, not evidence of present depth.
What the shape does not carry is the forecast. The vocabulary around profiles — acceptance, rejection, unfinished business at a node — is a set of expectations about revisits, and expectations are testable: behaviour at high-volume nodes against matched arbitrary levels, under a stated window and increment. The two lenses apply to a histogram exactly as they apply to a story.
The shape, drawn
The smallest arrangement the definition admits. It is a drawing of a rule, not a reading of a market — nothing here is measured, and the table below it is the authoritative version.
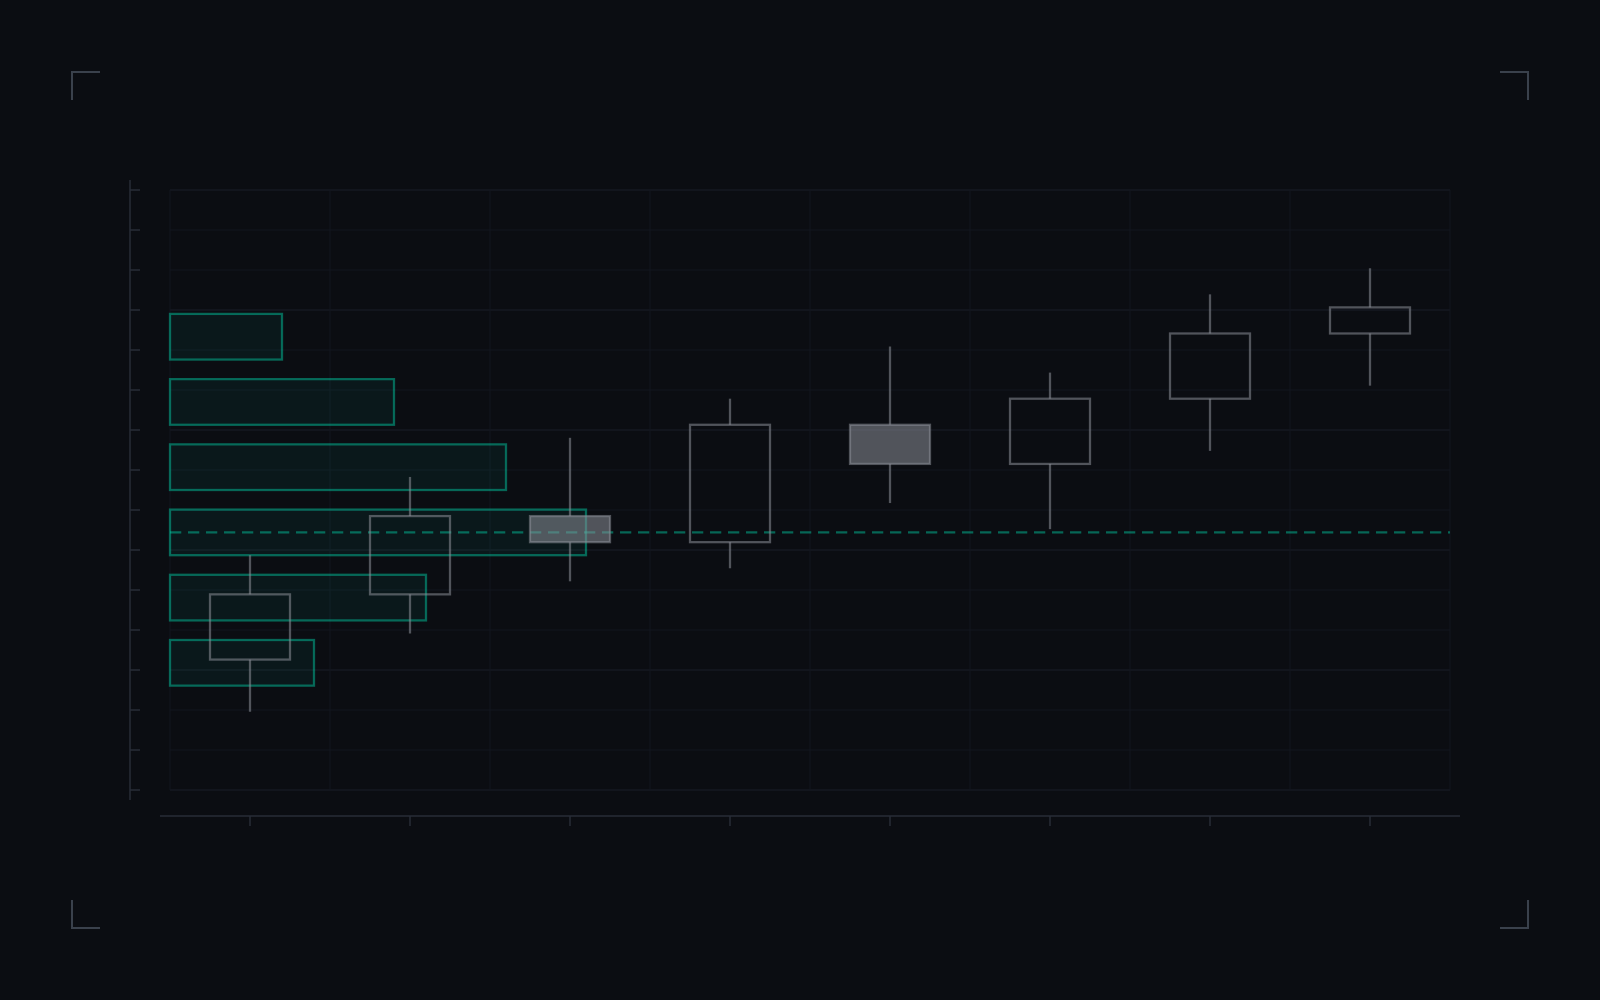
- Traded volume by price level over the window — a histogram lying on its side against the price axis.
- The widest row: the level where the window traded most. A fact about the past of one feed’s tape.
- The tape the profile summarises. The time axis is still there; the profile just refuses to use it.
Where the trading happened on the price axis: a histogram of traded volume by level over a chosen window, drawn against the tape it summarises. The widest row is where the window did most of its business; the dashed line marks it.
Drawing the profile establishes the construction. It does not establish that a heavily-traded level acts as anything on revisit — and the profile is a per-feed construction, since no consolidated tape exists to sum.
Volume profile: what the definition states, in full.
| Element | What the definition states |
|---|---|
| Construction | Traded volume summed by price level over a chosen window. |
| The windowA session, a day, a swing — the window is an election, and different windows draw different profiles from the same tape. | election pending |
| Per-feed | OTC FX has no consolidated tape; every profile is a construction over one feed’s trades. |
| Not established | That a high-volume level acts as support or resistance on revisit. |
Commonly confused with
Neighbouring concepts that get used interchangeably, and the distinction that actually separates them.
- Market profile
Market profile builds its histogram from time spent at each price, organised into TPO brackets; volume profile builds it from volume traded at each price. On liquid sessions the two often rhyme, and they are different measurements that diverge exactly when the difference matters — heavy volume traded quickly.
- The volume bar
A volume bar totals a time slice and says nothing about where inside the bar's range the business was done. The profile redistributes that same trading onto the price axis, which is the whole point: two identical volume bars can hide opposite profiles.
- A footprint chart
The footprint keeps per-bar, per-price detail with the aggressor side split out; the profile aggregates a whole window into one shape and discards the sequencing. One is a microscope for single bars, the other a map of a session or a range.
- Resting liquidity
A profile shows volume that traded; the book shows size that rests. High-volume nodes are records of past business, not evidence of present depth — conflating the two reads a history as a promise.
How to measure it in your own data
A definition you cannot test is a definition you have to take on trust. This is the shortest honest route from the concept to a number you computed yourself.
- Records you need
Tick or per-trade data with prices, sizes and timestamps over the declared window — and, in FX, the identity of the feed, because there is no consolidated tape and every profile is a profile of somebody's book.
- What you compute
Bucket traded volume by price at a declared increment; the modal price is the point of control, and the tightest band holding a declared share of the window's volume — seventy percent by convention — is the value area. Window, increment and share are all elections, and different elections draw different shapes from the same tape.
- What the answer tells you
A profile with pronounced high-volume nodes marks prices where trade concentrated — acceptance, in the vocabulary — and thin low-volume gaps mark prices crossed without business. What any of that implies about future behaviour at those prices is a separate, testable claim.
Questions and answers
What does a volume profile show?
Traded volume redistributed onto the price axis over a chosen window: which prices did the business, which were crossed in passing. Its named features — the point of control at the modal price, the value area holding a conventional share of volume — are summaries of that histogram, nothing more.
Is volume profile reliable in forex?
It is reliable as a measurement of the feed it came from. Spot FX has no consolidated tape, so an FX profile is built from one broker's ticks or one aggregator's slice — a real record of a partial market. Two feeds can draw different profiles of the same hour, and neither is wrong; they are profiles of different books.
What is the point of control?
The price with the most traded volume in the window — the profile's mode. Whether price later treats it as special is a measurable proposition, and the honest reading of any profile keeps the definition and the expectation separate.
What is the value area?
The tightest price band containing a declared share of the window's volume, seventy percent by convention. The share is an election, not a law — a sixty-eight or seventy-five percent value area is the same idea with a different number, and comparisons across tools that hide their share are not comparisons.
Related terms
Derived from the links this entry makes and the entries that link back to it.